| Home Page |
Overview |
Site Map |
Index |
Appendix |
Illustration |
FAQ |
About |
Contact |
The Observable Universe
Contents
The Observable Universe
Big Bang Theory
CMBR (Cosmic Microwave Background Radiation) Spectrum
CMBR Fluctuations
CMBR Polarization
CMBR Power Spectrum
Wilkinson Microwave Anisotropy Probe (WMAP)
Dark Energy, Dark Matter
Parallel Universes, Multiverse - the Unobservable Universe
Footnotes
References
Index
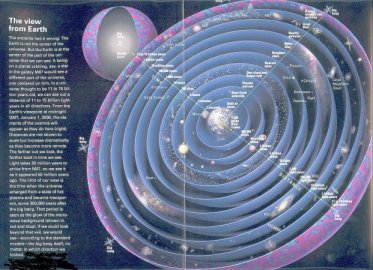
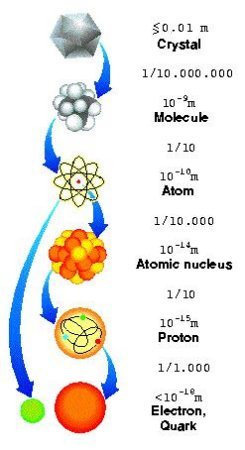
The observable universe is the space around us bounded by the event horizon - the distance to which light can have traveled since the universe originated. This space is huge but finite with a radius of 1028 cm. There are definite total numbers of everything: about 1011 galaxies, 1021 stars, 1078 atoms, 1088 photons. There is a hierarchy of structure: Everything is
 |
 |
composed of smaller things and is a part of something larger as shown in Figure 02-01a and Figure 15-01. The character of structures with different scale changes according to the interplay of various physical forces. Quantum phenomena control the small scales, while gravity dominates on large scales, and both come into play at the beginning of the universe. On each scale of size there is a corresponding scale of time: processes
|
Figure 02-01a The Observable Universe [view large image] |
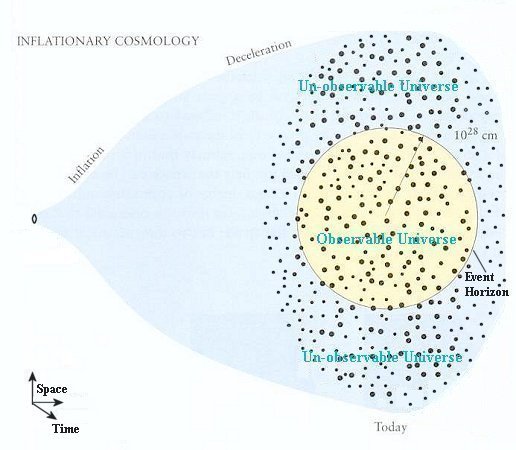
Figure 02-01b Inflationary Cosmology [view large image] |
tend to happen quickly on small scales and slowly on large scales.
|
Note that according to inflationary cosmology, the entire universe is much bigger than the observable one (see Figure 02-01b, not to scale), and the confine of observable universe depends on the location. Observers living in the Andromeda galaxy and beyond have their own observable universes that are different from but overlap with ours.
[Top]
Big Bang Theory1,2
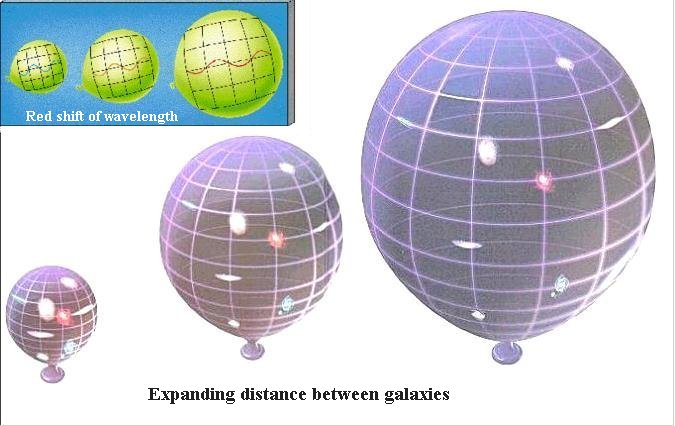 |
In 1922 Alexander Friedmann predicted the Big Bang cosmology, which portrays the universe as expanding space from a point where the matter-energy density was extremely high. The expansion can be visualized by a two dimensional analogy as shown in Figure 02-02. As the balloon expands, all the points on the surface recede from each other, and the wavelength on the surface is stretched. It is similar to the shift to longer wavelength when the source and receiver are moving away from each other. This phenomenon is called red shift of the spectrum because in visible light the shift to longer wavelength is toward the red colour. It plays a prominent role in discovering the cosmic expansion through the detection of the spectral line shift from distant galaxies. |
|
Note that contrary to the balloon analogy, it is the space itself that is expanding. It needs neither a center to expand away from nor empty space on the ouside to expand into. |
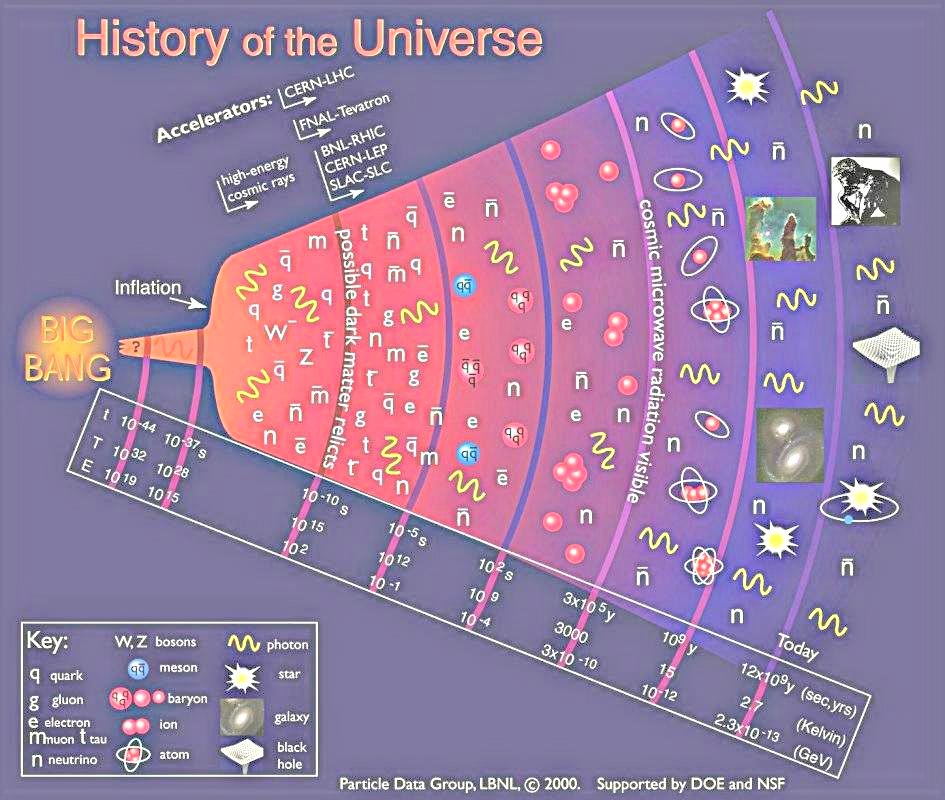
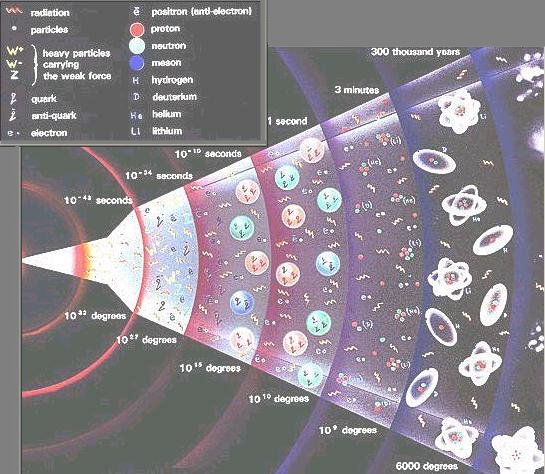
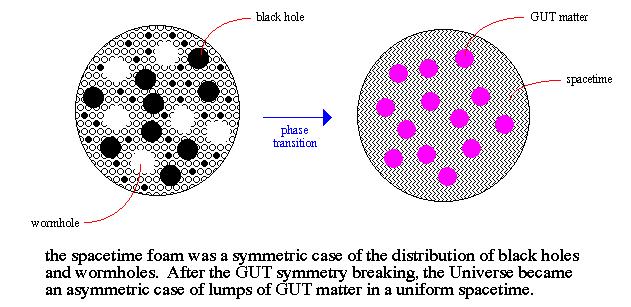
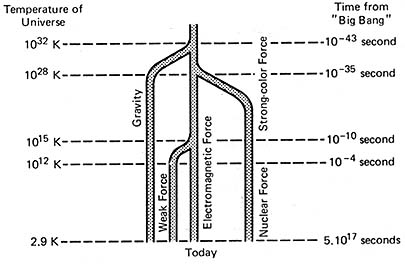
This simple picture of expanding universe with all the galaxies flying away from each other remained unchanged until the 1980s when the Inflation Theory3 was introduced to resolve a number of discrepancies. The rapid expansion occurred at the interval between 10-35 sec and 10-32 sec. It predicts a much smaller universe near the origin of the Big Bang such that the matter-energy within can be mixed evenly as reflected in the CMBR mapping. It also predicts that the geometry of the Universe is flata. Events before the inflation is essentially unknown. It is subjected to a lot of speculations. For example, it is suggested that space-time may be created from vacuum fluctuation - the quantum foam; and that the four fundamental forces may be unified to just one kind (as envisioned by the grand unified theories). Baryongenesis (generation of quarks and anti-quarks which has a baryon number of 1/3 or -1/3) happened in an epoch before inflation, when a imbalance between matter and anti-matter was established by a quantum process called CP violation. Quarks and anti-quarks combined to form baryons and mesons at 10-5 sec. Nucleosynthesis started at about 3 min. During this epoch the light chemical elements were produced from protons and neutrons. The universe was still opaque up to 380,000 years when neutral atoms started to form and the radiation was able to escape as shown by the CMBR. This epoch is called decoupling to indicate that matter and radiation are separated. From then on matter had a chance to condense into stars and galaxies and evolved to the present-day universe. Figure 02-03a shows the history of the universe according to the Big Bang Theory. Table 02-01 summarizes the major events during the course of the cosmic history.
 |
Supplement to the legend of Figure 02-03a:
The quark (q), electron (e), and neutrino (n) are the fundamental particles. The corresponding anti-particle is labeled with a bar on top. The gluon (g) is the boson mediating the strong interaction between quarks. The vector bosons W and Z mediate the weak interaction between electrons/neutrinos and the quarks. The photon (wavy line) mediates the electromagnetic interaction between charged particles. One quark and one anti-quark combine to form a meson. Three quarks combine to form a baryon (proton, neutron, etc.). Protons and neutrons combine to form nucleus (ion). Nucleus and electrons combine to form atom. The muon (m) and tau (t) are the 2nd and 3rd generation of the lepton family, the 1st generation is the electron. (See more about elementary particles in Topic-15.)
|
Figure 02-03a History of the Universe |
There are scales for the time t (in second), temperature T (in oK) and energy E (in Gev) at the bottom of Figure 02-03a. These variables are related by the simple mathematical formulas:
E(Gev) = 10-3 / t1/2(sec), and E(Gev) = 10-13 x T(oK)
There is no such simple formula for the size R of the early universe and these variables until 10-32 sec at the end of the inflation. Its relationship with time during that epoch can be plotted in a graph. After this period, the relation between size and time can be estimated roughtly as R(cm) = 1.8 x 10¹⁶ x t2/3(sec) according to the standard cosmological model.
Table 02-01 depicts the sequence of events after the Big Bang in time order. The relics and observables are physical facts, while the interpretations of the events are mostly theories or conjestures.
| Era |
Time |
Size
(observable) |
Energy or
Temperature |
Relics & Observables |
Events |
| Planck era |
< 10-43 sec |
< 10-53 cm |
> 1019 Gev |
4-dimensional spacetime;
cosmic expansion |
Smallest unit of space-time started to expand |
| GUT era |
< 10-35 sec |
< 10-48 cm |
> 1014 Gev |
Super-heavy particles; fundamental interactions
|
Separation of spacetime and mass; gravit-ational, strong, and electroweak forces |
| Inflation |
< 10-32 sec |
< 1 cm |
> 1013 Gev |
Observable universe;
large scale structures |
Unstable vacuum;
quantum fluctuations |
| Electro-weak era |
< 10-10 sec |
< 4x109 cm |
> 100 Gev |
Radiation; excess of matter over antimatter; separation of force and matter fields |
Radiation released in reheating; baryon-antibaryon asymmetry; separation of weak and electromagnetic forces, origin of mass |
| Strong era |
< 10-4 sec |
< 4x1013 cm |
> 200 Mev |
Exotic forms of dark matter |
Formation of hadrons from quarks including neutrons and protons |
| Weak decoupling |
< 1 sec |
< 2x1016 cm |
> 1 Mev |
Hydrogen nuclei domination |
Neutrinos decouple, neutron/proton ratio fixed |
| e-e+ Annihilation |
< 5 sec |
< 5x1016 cm |
> 0.5 Mev |
Photons hotter than neutrinos today |
Electron heat dumped into photons |
| Nucleo-synthesis |
< 100 sec |
< 4x1017 cm |
> 100 Kev |
Light element abendances: D, He, Li |
Nuclear reactions freeze out, stable nuclei form |
| Spectral decoupling |
< 106 sec |
< 2x1020 cm |
> 500 ev |
Blackbody background radiation |
End of efficient photon production |
| Matter ~ radiation |
< 104 yrs |
< 4x1023 cm |
> 3 ev |
Mass density fluctuations |
Matter density ~ radiation density |
| Recom-bination |
< 0.3 My |
< 7x1024 cm |
> 3000 K |
CMBR |
e- and p+ recombine into H atoms, universe transparent to light |
| Dark ages |
< 1 Gy |
< 1027 cm |
> 20 K |
First stars, heavy elements |
mass fluctuations grow, first small objects coalesce, reionization |
| Galaxy formation |
< 2 Gy |
< 2x1027 cm |
> 10 K |
Stars, quasars, galaxies |
Collapse to galactic systems |
| Bright ages |
< 13 Gy |
< 9x1027 cm |
> 3 K |
Milky Way and Solar System |
Gas consumed into stars, remnants, planets |
| Present era |
~ 13.7 Gy |
~ 1028 cm |
~ 2.73 K |
Supercluster |
Large scale gravitational instability |
Table 02-01 A History of Cosmic Expansion
In an effect to learn more about the processes occurred in the early universe, which was associated with very high energy as shown in Table 02-01. Particle Physicists have been simulating the condition in the laboratory with high energy particle accelerators (see the entries in top left of Figure 02-03a). In collaborating with the theory of elementary particles, experiments are developed to investigate the creation of fundamental particles, and their properties. A list of the major accelerators in the world is shown in Table 15-01.
The following is a summary of the evidences which support the validity of the Big Bang Theory.
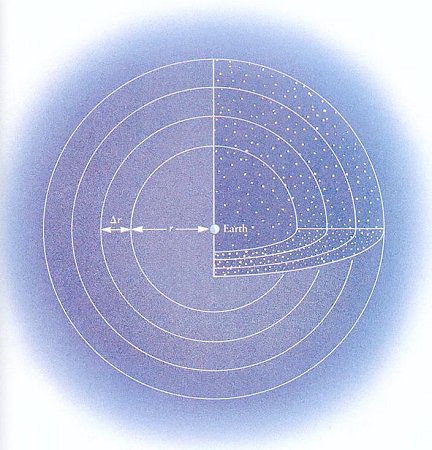 |
- The Night Sky : It is referred to as the Olber's Paradox. He posed the question way back in 1823. According to his calculation, the night sky would glow brightly from all the stars if the universe is infinite both in space and in time. The arguement is illustrated by Figure 02-03b, which shows the night sky receiving light from stars in successive spherical shells
 r. The total amount of light reaching the earth is equal to the sum of nLr from all the shells, where n is the density and L is the intrinsic luminosity of the stars. Since it was believed that the universe is infinite, and so we would expect the night sky to be about as brilliant as a star's surface.
Obviously, this is not true. The paradox is resolved by the Big Bang Theory which limits the observable horizon to about 1028 cm. and an age of about 14 billion years. In addition, the light from remote objects is also diminished by the red shift of the spectrum. r. The total amount of light reaching the earth is equal to the sum of nLr from all the shells, where n is the density and L is the intrinsic luminosity of the stars. Since it was believed that the universe is infinite, and so we would expect the night sky to be about as brilliant as a star's surface.
Obviously, this is not true. The paradox is resolved by the Big Bang Theory which limits the observable horizon to about 1028 cm. and an age of about 14 billion years. In addition, the light from remote objects is also diminished by the red shift of the spectrum.
|
|
 |
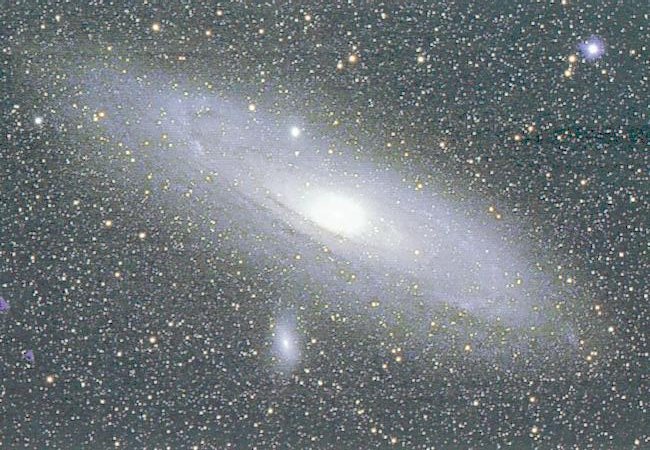
- The Red Shift : It was discovered in the 1920s that Andromeda and other similar smears of light were akin to our own Milky Way. Subsequently, it was noticed that more distant galaxies are receding faster than those nearby - an observation that could be explained if the universe were expanding. The speed of recession is measured by red shift of the spectral lines. The distance is measured by standard candle such as the class of stars known as Cepheid Variable which, possesses an unique relationship between the period (of brightness variation) and its intrinsic luminosity. The speed-distance relation is known as the Hubble's law. It is a
| |
very simple formula equating the speed v to the distance d, i.e., v = Ho x d, where Ho is the Hubble's constant. It has a value of 71 (km/sec)/Mpc according to the latest measurement by WMAP (see Figure 02-03c). | |
The redshift z is defined by:
z = ( - o) / o
where o is the wavelength at rest, and is the red shifted wavelength.
The relationship between the redshift z and the distance d is given by the following formaula:
d = (c/Ho) x [(1 + z)2 - 1] / [(1 + z)2 + 1]
where c = 3x1010 cm/sec is the velocity of light.
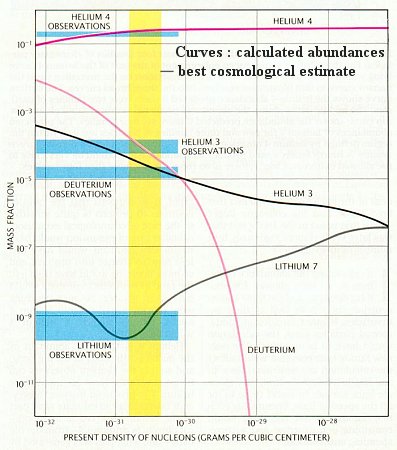 |
- Nucleosynthesis : The universe's light-element abundance is another important criterion by which the Big Bang Theory is verified. It is now known that the elements observed in the Universe were created in either of two ways. Light elements (namely hydrogen, deuterium, helium, and lithium) were produced in the first few minutes of the Big Bang, while elements heavier than lithium are thought to have their origins in the interiors of stars which formed much later in the history of the universe. The relative abundances of the light atomic nuclei has been calculated as a function of the average density of the universe based on the Big Bang model. There is a convincing coincidences between the observed and calculated values at a density of 3x10-31 g/cm3 (Figure 02-03d). This density implies an open universe, which will keep on expanding forever. Such conclusion seems to be in contradiction with the Inflation Theory which predicts a flat universe at the critical density of 10-29 gm/cm3. This problem could be resolved by the presence of "dark matter".
|
|
|
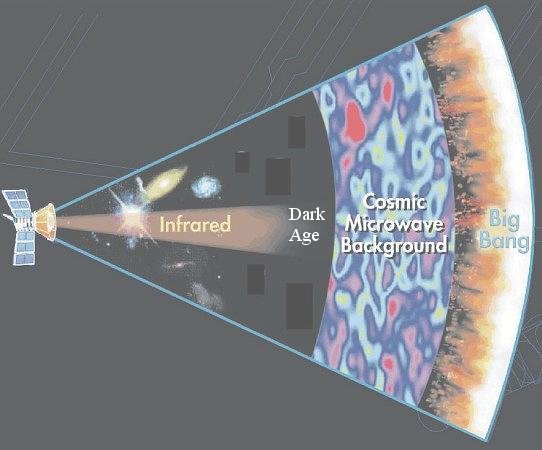
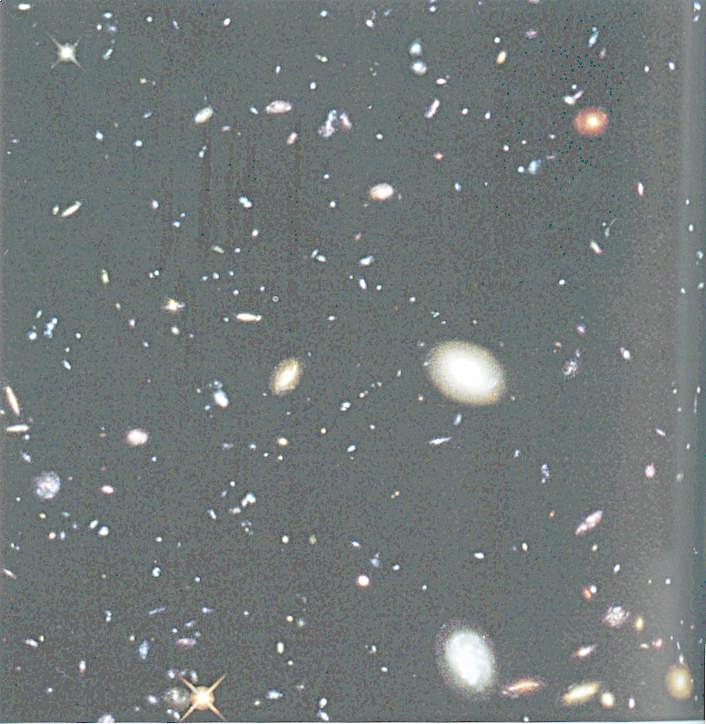
- Hubble's Deep Field Survey : The Hubble Space Telescope (HST) was launched on April 24, 1990. Since then it has collected photographs of various celestial objects in astonishing details. One of the photos called Hubble Deep Fields has captured astronomical objects from nearby star to some immature galaxies near the beginning of the Big Bang. We
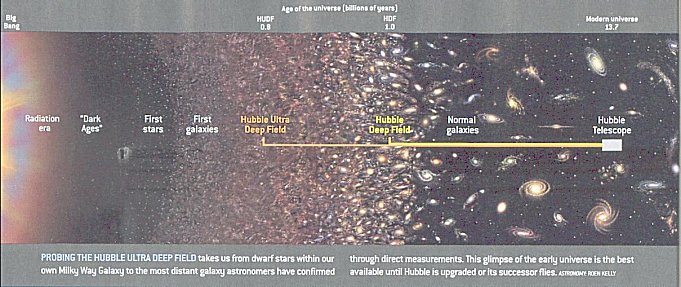 |
are able to sample different epochs in the photo because light from the nearer objects reaches us sooner than from those further out (because light propagates with a finite speed of 3x1010 cm/sec). The objects in the photo can be separated by redshift into a series of images corresponding to different epochs. It unveils a universe that is steadily changing over time, just as the Big Bang predicts. Figaure 02-03e shows the scope of the survey including the Hubble Ultra Deep Field. |
|
|
- Cosmic Microwave Background Radiation : See section on WMAP.
[Top]
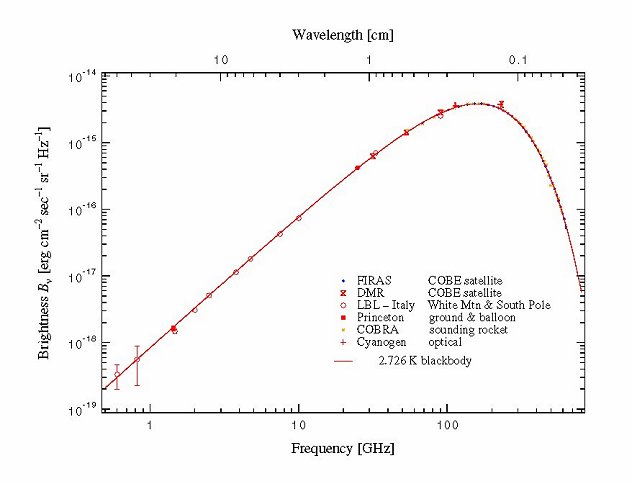 |
It was discovered in 1965 that there is a feeble microwave radiation emanating uniformly from all directions in the sky. It contributes about one percent to the static on a television screen that is not tuned to a local channel. This is the cosmic microwave background radiation (CMBR). The CMBR spectrum is identical to a blackbody radiation of 2.726oK as shown in Figure 02-04. The solid line represents the blackbody radiation spectrum that has been computed from theory. The data being represented by various symbols are collected from various measurements. The agreement between observation and theory is remarkable. |
|
|
[Top]
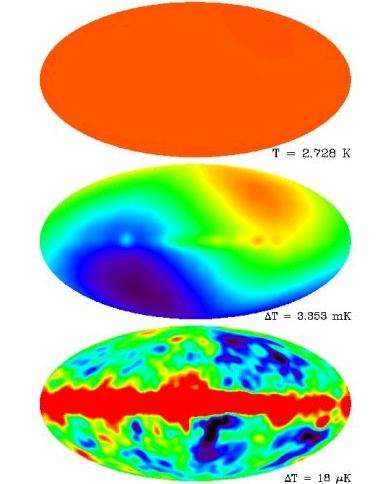 |
The all sky maps in Figure 02-05 shows the three views of CMBR (in false colours) with increasing sensitivity (in temperature variation). To a first approximation the sky is uniform (top). At a sensitivity level of 1 part in 1000, it reveals a shift in wavelength to blue and red (middle) . The pattern is caused by the motion of the earth relative to the frame of the CMBR. When this shift is subtracted off, fluctuations are visible at a sensitivity level of 1 part in 100000 (bottom). The red band in the middle is the emission from the Milky Way. Figure 02-06 shows the final view after all the corrections have been applied. The slight variation in temperature then takes on a blotchy appearance with each patch a little above or below the average temperature of 2.726oK. All the above-mentioned observations can be interpreted in a consistent way by the Big Bang Theory. According to this theory the CMBR was emitted about 380000 yr. after the Big Bang when neutral atoms (such as the hydrogen atoms) started to form. As the neutral atoms interact much less to the radiation, they became free and escaped the fireball at a blackbody temperature of about 4000 oK. It takes about 14 billion years to reach us and has since been cooled down to 2.726 oK by the cosmic expansion. |
Figure 02-05 The Three Views of CMBR |
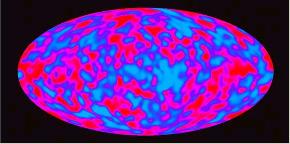 |
The patchy features in Figure 02-06 are related to the fluctuations occurred close to the beginning of the universe. The CMBR is the furthest astronomical phenomenon that can be witnessed by any beings because the universe was opaque before this event. It is like looking up in a cloudy day when nothing can be seen beyond the cloud ceiling.
|
Figure 02-06 Cosmic Microwave Background Radiation |
[Top]
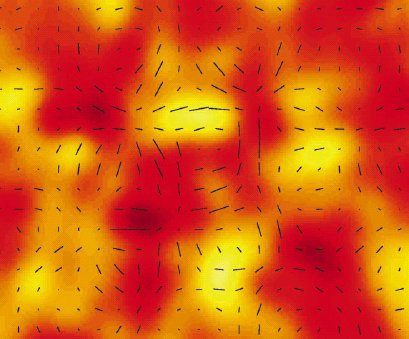 |
Recently in 2002, the Degree Angular Scale Interferometer (DASI) has detected partial polarization of the CMBR at the sensitivity level of one part in a million. In Figure 02-07 the temperature fluctuations are represented by yellow for hotter, red for colder regions. Superimposed is the polarization measured by DASI7. The polarization at each point is represented by a black line, whose orientation and length correspond to the direction and amount of polarization, respectively. These polarization patterns were formed at the beginning of the reionization era, when the first starlight began ionizing the cold hydrogen that filled the universe after the Big Bang cooled. According to the latest measurement by WMAP, it implies that the first stars were born about 100 to 400 million years after the Big Bang.
|
Figure 02-07 CMBR Polarization |
[Top]
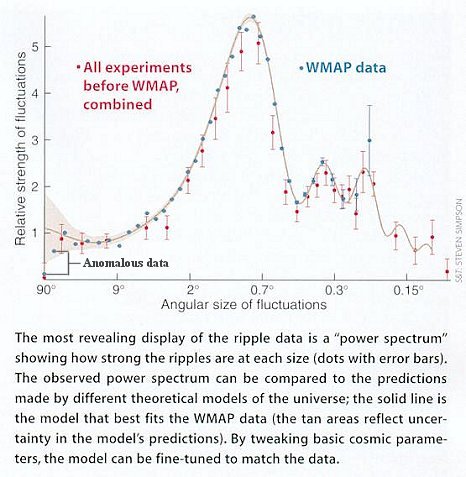 |
Theoretical physicists use the power spectrum plot to determine the cosmological parameters by the observational data. Essentially, the power spectrum is a plot of the amount of fluctuation against the angular (or linear) size. The fluctuation is the difference in the two measurements at the corresponding points. It can be the fluctuation of temperature or density or any other kind of measurable quantity. Figure 02-08 shows just one example with the WMAP observational data superimposed on a theoretical curve. The theoretical curve varies with several parameters such as the total cosmic density, the baryon density (luminous matter) and the Hubble's constant. The best fit model is the lambda cold dark matter model with an initial inflation, a period of galaxies formation induced by cold dark matter, and then the speedup of the cosmic expansion. However, none of the theoretical models based on inflation can account for the anomalous data in Figure 02-08 at large angular size. Double checking the instruments and analysing procedures also fails to explain the anomalies. More observations are needed to resolve the puzzle. |
|
[Top]
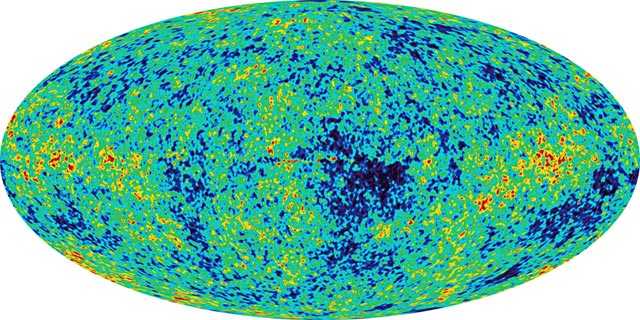 |
The Wilkinson Microwave Anisotropy Probe (WMAP) team has released the first detailed full-sky map of the oldest light in the universe on February 11, 2003. Figure 02-09 shows the measurements with red indicates "warmer" and blue indicates "cooler" spots. The patterns in the map are tiny temperature differences within an extraordinarily evenly dispersed microwave radiation bathing the Universe, which now averages a frigid 2.73 degrees above absolute zero temperature. WMAP resolves the slight temperature fluctuations, which vary by only millionths of a degree. Analyses of this microwave radiation emitted only |
Figure 02-09 High Resolution CMBR |
|
380,000 years after the Big Bang appear to define our universe more precisely than ever before. Measurements from WMAP resolve several long-standing disagreements in cosmology rooted in less precise data. Specifically, present analyses of the WMAP all-sky image indicate that the universe is 13.7 billion years old (accurate to 1 percent), composed of 73 percent dark energy, 23 percent cold dark matter, and only 4 percent atoms, is currently expanding at the rate of 71 km/sec/Mpc (accurate to 5 percent), underwent episodes of rapid expansion called inflation, the geometry of the Universe is flat1, and will expand forever. The Wilkinson Microwave Anisotropy Probe was launched on June 30, 2001. It is designed to operate for four years.
[Top]
It seems that the Big Bang Theory has been validated conclusively with all these supporting evidences. However, recent observations in the last few years reveal that there is something amiss. It is noticed that even though there is not enough mass to hold the stars, galaxies and galaxy clusters in place, they are still moving around and would not disperse. It looks as if there is some kind of invisible force (gravity from the dark matter) to hold them together. The situation is similar to a puppet show, where the audience can safely assume that someone behind is manipulating the movements.
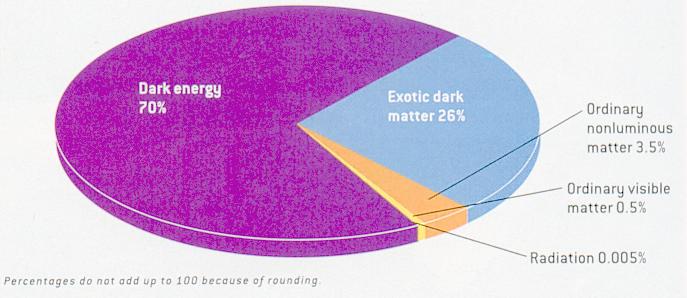 |
The second problem is related to the use of the Type Ia supernovae as "standard candles" to measure the distance of remote objects. The measurements imply that the cosmic expansion is accelerating. It is proposed that there is some kind of repulsive "dark energy" to induce the acceleration. Figure 02-10a shows the proportion of the various matter-energy components in the Universe. Most of the matter-energy content is in the form of "dark energy". The composition of the Universe is listed in Table 02-02 below. |
Figure 02-10a Energy-Matter in the Universe
[view large image] |
|
Acceleration of the cosmic expansion is placed on a firmer footing when it is observed in 2003 that the CMBR becomes slightly hotter after going through a galaxy, which forms a gravitational (potential) well. Dark energy, being gravitationally repulsive, makes a gravitational well shallower as a photon passes through, so the photon exits with slightly more energy than it had when it entered.
| Material |
Representative Particles |
Particle Mass or Energy (ev) |
No. of Particles in Observed Universe |
Probable Contribution to Mass of Universe |
Sample Evidence |
| Ordinary matter |
Protons, electrons |
106 to 109 |
1078 |
5% |
Direct observation, inference from element abundances |
| Radiation |
photons |
10-4 |
1087 |
0.005% |
Microwave telescope observations |
| Hot dark matter |
Neutrinos |
< 1 |
1087 |
0.3% |
Neutrino measurements, cosmic structure |
| Cold dark matter |
Supersymmetric particles? |
1011 |
1077 |
25% |
Inference from galaxy dynamics |
| Dark energy |
Scalar particles? |
10-33 |
10118 |
70% |
Supernova observations of accellerated cosmic expansion |
Table 02-02 Composition of the Universe
The nature of both the "dark matter" and "dark energy" is still the subject of intense research observationally and theoretically. Some of the suggestions are listed below:
- Cosmological constant - Eistein had introduced a term with the cosmological constant in the gravitational field equation to keep a static universe from collapsing.
This additional repulsive force is no longer necessary when the cosmic expansion became apparent. It has become fashionable again with the new discovery of cosmic acceleration. It is very tempting to identify the cosmological constant with the vacuum energy of the various quantum fields. However, the simplest versions of quantum theory predict far too much energy. One explanation involves the cancellation of all these fields (of vacuum energy) to almost zero, leaving only a residual trace corresponding to the observed dark energy.
- Quintessence - This hypothetical form of dark energy permeates all space. Like inflation, quintessence is thought to have somehow originated when the universe was just 10-35 sec old. It is driven by a scalar field whose energy varies gradually. The difference is the energy and time scale: inflation occurred quickly at very high energies, whereas the scalar field responsible for quintessence operates at much lower energies over a much longer time frame.
- Neutrino - It is a reasonable candidate for dark matter because of its unreactive nature. Theoretical calculations indicate that there should be as many as 100 million neutrinos for every atom in the universe. However, the recent estimates of neutrino mass is so slight that it could account for only about 0.1 - 7 per cent of the mass of the universe.
- WIMP - Many new particles with heavy mass appear in the supersymmetry formulation. These are referred to as weakly interacting massive particles, or WIMPs. For example, the photino (the fermionic partner of photon) has a mass about 10 to 100 times that of the proton. Most of these electrically neutral particles would, like neutrino, go straight through Earth. On rare occasion, however, one might interact with an atom in the material they pass through. So far, the only claimed detection of a dark matter particle (by an Italian team in 2000) has been strongly disputed.
- Nonluminous matter - Ordinary hidden matter consists of atoms that emit little or no light. It includes a host of celestial objects such as planets, dark gas clouds, brown dwarfs, neutron stars, and black holes. The Massive Compact Halo Objects Project (MACHO) has been looking for them in the halo of the Milky Way. A search for microlensing has turned up four candidates toward the Large Magellanic Cloud and 45 toward the Galactic Bulge.
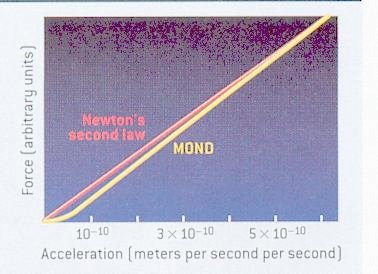
- MOND - It is proposed that instead of looking for the dark matter, slight altering of Newton's second law will account for the discrepancy. The formula F = ma is amended in such a way that smaller gravitational force or mass can impart a given acceleration in a certain range (see Figure 02-10b). According to MOND (Modified Newtonian Dynamics), a test particle at a distance r from a large mass M is subject to the acceleration a by the following formula:
 (a/a0) a = G M / r2
where G is the gravitational constant, a0 ~ cH0 ~ 10-8 cm/sec2 is the MOND parameter, H0 is the Hubble constant, and (a/a0) is a function of a/a0 such that (a/a0) ~ a/a0 for a/a0 << 1, and (a/a0) ~ 1 for (a/a0) >> 1.
Figure 02-10c shows the MOND prediction on mass discrepancy for many astronomical objects. Its main failure
 |
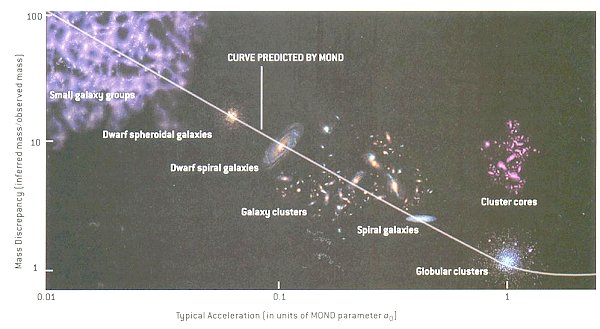 |
occurs in the cores of large galaxy clusters. Since its proposal in 1983, MOND has become a controversial subject among astronomers. It is considered as a rather ad hoc invention to fit this special problem of dark matter. Even if it is correct, the new formula should be derived from a more fundamental theory.
|
|
|
|
Since we don't feel the effect of dark energy and dark matter around us except through the gravitational influence on large scale, a model has been constructed with no noticeable interactions between each other or with ordinary matter. It fits the observational data such as the high-redshift supernovae, the microwave background radiation, the distribution of large-scale structure, and the dynamic of celestial objects very well. The dominance of dark energy and dark matter over ordinary matter indicates that human beings are extremely unimportant in the grand scheme of the universe as suggested in a 1985 movie called "Insignificance" in which Einstein and Monroe explores relativity and our place in the universe.
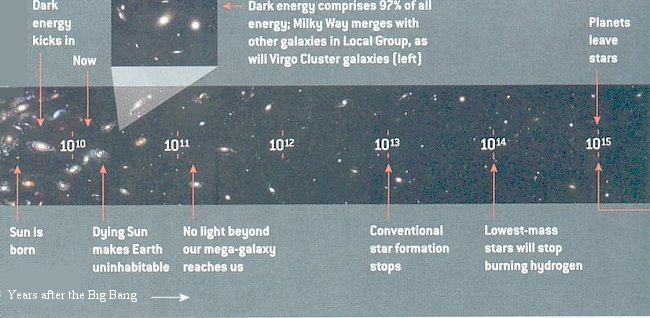
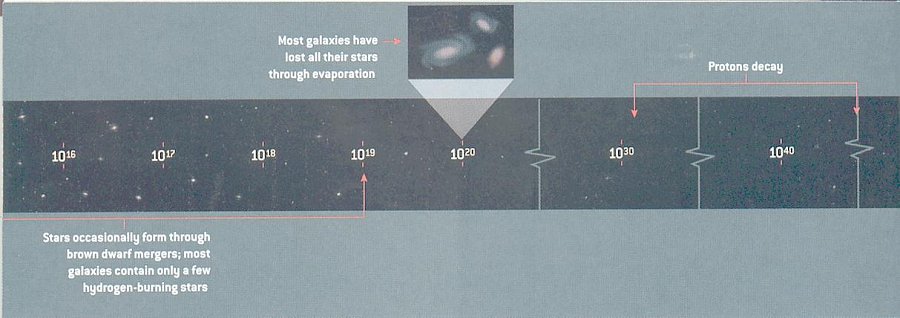
It seems that the effect of dark energy became dominant only recently about 8 x 10⁹ years after the Big Bang. If the acceleration presists in the future, it will impose a horizon surrounding a galaxy like the Milkyway - a distance beyond which light cannot reach us. Figure 02-10d depicts the sequence of events for the future of the universe with cosmic acceleration according to a computer simulation (click image to obtain larger view). The model assumes that the dark energy permeating the vacuum has a positive, constant value - similar to the cosmological constant, as Einstein once posited.
 |
 |
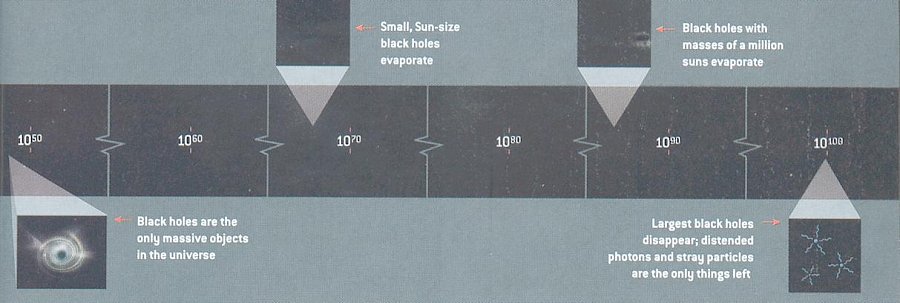 |
| Figure 02-10d Future of the Universe |
|
[Top]
The subject of parallel universes used to belong to the realm of science fictions. The idea is familiar on some TV shows such as "Star Trek", which portrays other worlds that are almost like our own, except ... there is a slight difference. Then some cosmologists propose that our Universe might be just one of many in an ever-multiplying network of parallel universes, which they call the multiverse. Recent observational data open up the possibility that it is conceivable scientifically with some imaginative inferences.
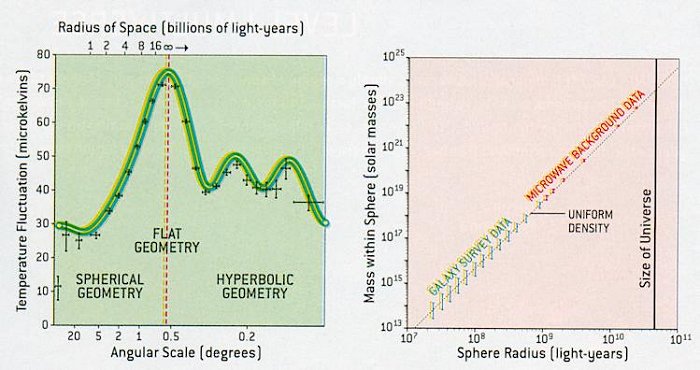 |
Figure 02-11 shows recent astronomical observations, which tend to support the hypothesis.
The diagram on the left illustrates the WMAP measurementb of the fluctuations in the CMBR temperature. The strongest fluctuations are just over half a degree across, which indicates that space is very large or infinite. In addition, the diagram on the right illustrates the measurements of matter density from WMAP and 2dF Galaxy Redshift Surveyc. They are consistent with uniform distribution of matter on large scales.
|
Figure 02-11 Universe, Flat and Uniform |
|
 |
These observational data support the inflation theory, which suggests that the universe underwent an exponential expansion at 10-35 sec after the Big Bang. The universe became so large that it looks flat within our event horizon, and in addition, the contents in the universe were mixed uniformly as witnessed by the CMBR.
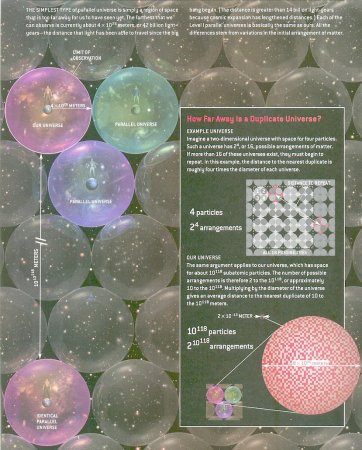
Our universe with a size of about 1026 meters (as limited by the event horizon) is just a speck in comparison to this vast expand. The number of ways to arrange matter in the space outside our universe is enormous and each one would have its own event horizon (size); these are the parallel universes. Statistically, an arrangement similar to ours is bound to happen given enough space. Thus there would be universes identical to ours somewhere. However, we cannot communicate with any of these parallel universes because the speed of light is finite.
This conclusion is derived from elementary probability and does not assume speculative modern physics, merely that space is infinite (or at least sufficiently large) in size and almost uniformly filled with matter, as observations indicate. In infinite space, even the most unlikely events must take place somewhere.
|
| |
|
Followings is a more elaborated deduction with simple mathematics:
- The radius of the observable universe is taken to be 4x1026 m. It is assumed that the matter in the universe consists of nucleons, which has a radius of about 2x10-13 m.
- Therefore, the universe has roughly 10118 partitions for the nucleons.
- These partitions can be filled or unfilled according to the configuration of the universe. The total number of different arrangements is 210118.
- A box with a radius of 210118x1026 m ~ 210118 m would exhausts all the possibilities. It contains possibly all kinds of parallel universes.
- Beyond that box, universes - including ours - must repeat. The identical parallel universe would be about 210118 m away as shown in Figure 02-12 (the number there has been "round off" to 1010118 meters).
There are even more exotic scenarios about multiverse:
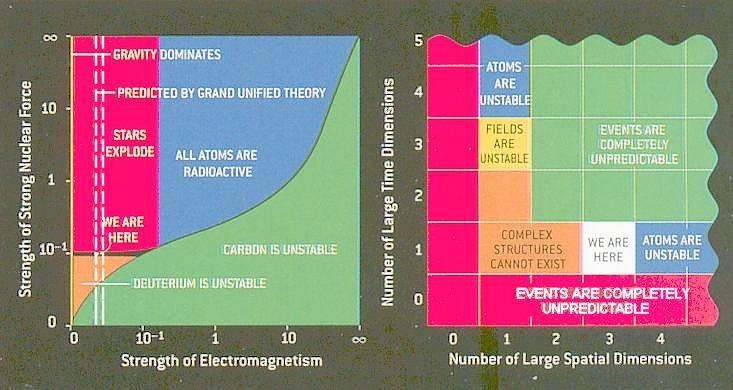 |
- Our universe and contiguous regions of space is a bubble embedded in an even vaster but mostly empty volume. Other bubbles exist out there, disconnected from ours. They nucleate like raindrops in a cloud. During nucleation, each one may acquire different strength of the forces, and may emerge with different spatial and temporal dimensions. It all depends on the outcome of symmetry breaking. The anthropic principle dictates that we see the universe the way it is because if it were different we would not be here to observe it (see Figure 02-13 and Topic 15).
|
| |
|
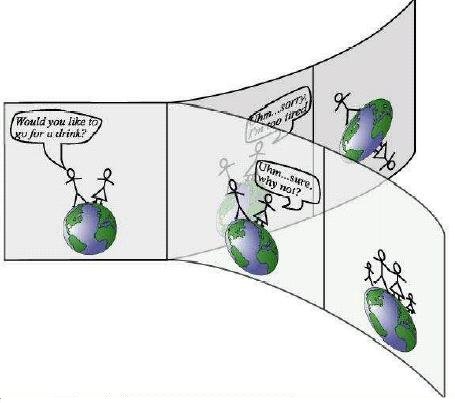 |
- In quantum mechanics the superposition of quantum states suddenly "collapsed" into a definite quantum state when we make a measurement. For example, measurement of the spin state for a spinning particle would yield either 1 or 0; it would not be any value in between. Generalization of this concept to the macroscopic world suggests that one classical reality would gradually split into superpostions of many as shown in Figure 02-14. Observation experiences one of the splittings by a decoherent process, which mimics wavefunction collapse. The classical states (no weird happening such as being in two different places at once) are observed because they are in the most robust states.
|
| |
|
 |
- The correspondence between mathematics and physics has been a source of debate that goes as far back as Aristotle and Plato. According to the Aristotelian paradigm, physical reality is fundamental and mathematical language is merely a useful tool. The Platonic argument considers the mathematical structure to be the true reality and observers only perceive it imperfectly. Thus a fundamental asymmetry appears to be built into the very heart of reality - why is only one of the many mathematical structures singled out to describe our universe? It is suggested that complete mathematical symmetry holds: that all
|
| |
|
mathematical structures exist physically as well. Every mathematical structure corresponds to a parallel universe. As a consequence, each universe is governed by its own fundamental laws of physics (see more in Topic 15). In Figure 02-15 Aristotle points down to the reality on earth while Plato points up to multiverse.
[Top]
aSince the inflation has generated a much bigger universe than we can see, the visible universe becomes flat to our perception just like the flat Earth in local view. This implies parallel lines will never meet no matter how far they are extended, and the familiar scenery of galaxies and galaxy clusters would extend infinitely far beyond our cosmic horizon.
bThe first peak (the whole curve) of the power spectrum moves from left to right with increasing radius of space.
cThe 2dF redshift survey uses the two-degree field spectroscopic facility on the Anglo-Australian Telescope to measure the redshifts of 250,000 galaxies.
[Top]
- Big Bang Tour (animation) -- http://superstringtheory.com/cosmo/cosmo3.html
- Cosmology (lecture notes) -- http://blueox.uoregon.edu/~jimbrau/astr123
- Inflation -- http://www.ucolick.org/~patrik/ay5/notes/lecture15.pdf
- CMBR Spectrum -- http://archive.ncsa.uiuc.edu/Cyberia/Cosmos/Footprints.html
- CMBR Fluctuations -- http://pancake.uchicago.edu/~carroll/ourpreposterous/img19.htm
- CMBR Polarization -- http://www-news.uchicago.edu/releases/02/020918.carlstrom.shtml
- CMBR Polarization, DASI home page -- http://astro.uchicago.edu/dasi/
- CMBR Power Spectrum -- http://www.livingreviews.org/Articles/Volume1/1998-11jones/node2.html
- CMBR Power Spectrum (animation) -- http://background.uchicago.edu/~whu/intermediate/gravity.html
- Wilkinson Microwave Anisotropy Probe (WMAP), Home Page -- http://map.gsfc.nasa.gov/
- Dark Energy, Dark Matter -- http://hitoshi.berkeley.edu/290E/
- Parallel Universes, Multiverse -- http://www.hep.upenn.edu/~max/multiverse.html
[Top]