|
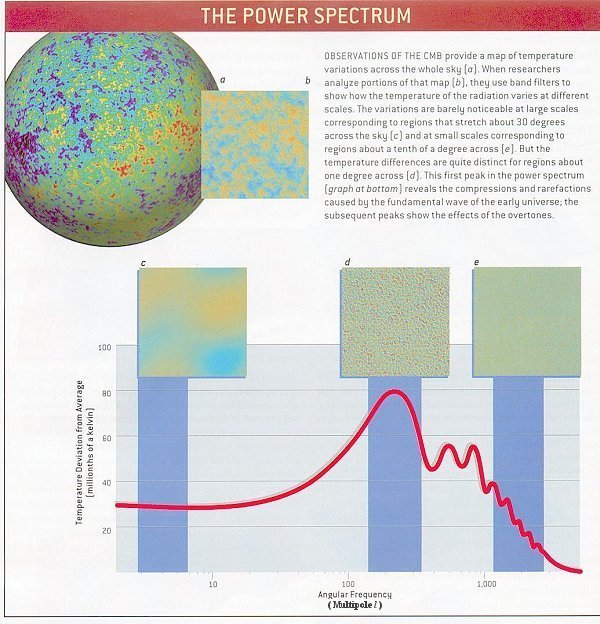
Theoretical physicists use the power spectrum plot from the observational data to determine the cosmic parameters. Essentially, the power spectrum is a plot of the amount of fluctuation against the angular (or linear) size. The fluctuation is the difference in the two measurements at the corresponding points. It can be the fluctuation of temperature or density or any other kind of measurable quantity. Figure 01 shows the fluctuation of temperature at different (inverse) angular scales. It is a theoretical model based on several parameters such as the total cosmic density, the baryon density (luminous matter) and the Hubble's constant as explained in more details below. |
Figure 01 Power Spectrum [view large image] |
 k{Gk cos(kx)} ---------- (1)
 /L, L is the wavelength. {F(x) cos(kx)}, where the sum is over all x. For a given value of k, its harmonics are 2k, 3k, 4k, ...; k is called the fundamental mode. Inflation predicts that the amplitude Gk of each of the modes is random. In addition, the distribution of probabilities follows the shape of a bell curve (known as Gaussian) of very nearly the same width for each mode. The resulting power spectrum is called flat because of its lack of distinguishing features. Significant deviations from flatness should occur only in those modes produced at either the end or the beginning of inflation./(2 sound horizon). Modes caught at oscillations with such wavelength become the peaks in the CMRB power spectrum and form a harmonic series based on k1.
 ,
, ), where l=0 denotes the monopole, l=1 the dipole, l=2 the quadrupole, ..., and m can be any integer between -l and l. The coefficient Gk is replaced by Cl. Each Cl constitutes a multipole mode.
Thus in terms of spherical harmonics, the angular variation can be expressed as:,) = l{ClmYlm(,) } ---------- (2)
), where l=0 denotes the monopole, l=1 the dipole, l=2 the quadrupole, ..., and m can be any integer between -l and l. The coefficient Gk is replaced by Cl. Each Cl constitutes a multipole mode.
Thus in terms of spherical harmonics, the angular variation can be expressed as:,) = l{ClmYlm(,) } ---------- (2)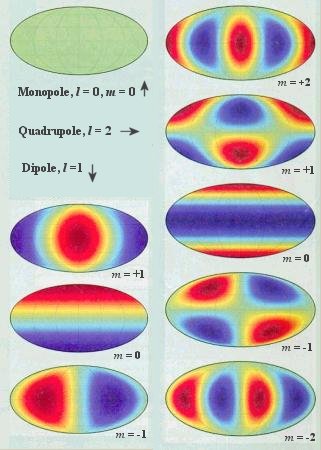 |
Any map drawn on a sphere, whether it be the CMBR's temperature or the topography of the earth, can be broken down into multipoles. The lowest multipoles are the largest-area, continent- and ocean-size undulations on the temperature map. Higher multipoles are like successively smaller-area plateaus, mountains and hills (and trenches and valleys) inserted on top of the larger features. The entire complicated topography is the sum of the individual multipoles. The lowest mode (l=0) is the monopole - the entire sphere pulses as one. This is the average temperature (2.726oK) of the CMBR. The next lowest mode (l=1) is the dipole, in which the temperature goes up in one hemisphere and down in the other. In the CMBR mapping, the dipole is dominated by the Doppler shift of the solar system's motion relative to the CMBR; the sky appears slightly hotter in the direction the sun is traveling (see Figure 02-05 in Topic 02, Observable Universe). The CMBR power spectrum begins at Cl=2 because the real information about cosmic fluctuations begins with the quadrupole (l = 2). Note that the peak variation occurs at about l = 200 corresponding to an angular size of about 1 degree. Figure 02 |
Figure 02 Multipoles |
shows the multipoles with l = 0, 1, 2. The red color represents variation above the average (green); while the blue color denots less. |
 |
|
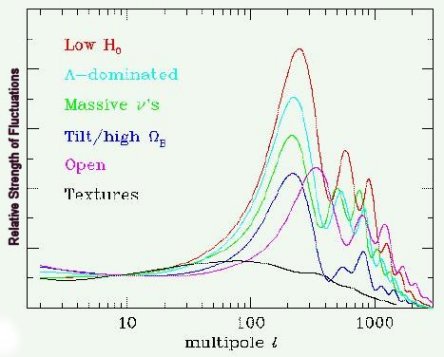
Figure 03 Power Spectrum Models [view large image] |