Home Page Overview Site Map Index Appendix Illustration FAQ About Contact


Superclusters


Contents

Large Scale Structures
The Virgo Supercluster
Formation of Superclusters
Density Fluctuations
Power Spectrum of Cosmic Structure
References
Index

Large Scale Structures1,2

Coma Supercluster

The reality of superclusters did not sink in until the 1980s, when new telescopes and sensors could produce three-dimensional maps of the universe. Superclusters are typically seen as long and thin strands of clusters and galaxies, intracluster gases and, presumably, "dark matter" on a two dimensional surface. The strands are interspersed by large voids nearly empty of matter. Figure 03-01 shows the Coma supercluster in a slice of the universe with our position at the vertex. This map extends to a depth of 300 million light years (3x1026 cm). It confirmed that the galaxies in the universe are arranged in sheets and walls surrounding large nearly-empty voids.

Figure 03-01 The Coma Supercluster

large scale structure Figure 03-02 is a three dimensional map of the universe inside a sphere with a radius of 500 million light years. Each point represents a group of galaxies. The solid lines indicate which quadrant the points are located on the upper hemisphere, while the dotted lines indicate the locations on the lower hemisphere. The Milky Way (a member of the Virgo supercluster) is at the center of the sphere. It shows most of the major galaxy superclusters that surround the Virgo supercluster. These superclusters are not isolated in space but together with many other smaller concentrations of galaxies, they form parts of extensive walls of galaxies surrounding large voids. Three of the biggest walls as well as several of the largest voids are marked on the map. The Virgo along with the Hydra and other superclusters are streaming at a speed of 6x107 cm/sec

Figure 03-02 Large Scale Structures [view large image]

toward the "Great Attractor", which is a gigantic unseen mass located near A3627 in the Centaurus Wall. In comparison, the speed of cosmic expansion is about 7x108 cm/sec at a distance of 100 megapc.


Galaxy Survey Figure 03-03 presents a different view of the large scale structure, which covers a region of sky about 100o by 50o around the South Galactic Pole. The APM3 (Automatic Plate Measuring) Galaxy Survey contains positions, magnitudes, sizes and shapes for about 3 million galaxies. The picture shows the galaxy distribution as a density map on the sky. Each pixel covers a small patch of sky 0.1o on a side, and is shaded according to the number of galaxies within the area: where there are more galaxies, the pixels are brighter. Galaxy clusters, containing hundreds of galaxies closely packed together, are seen as small bright patches. The larger elongated bright areas are superclusters and filaments.

Figure 03-03 APM Galaxy Survey [view large image]

These surround darker voids where there are fewer galaxies. The colours are coded according to the apparent magnitude of the galaxies in each pixel: fainter galaxies are shown as red, intermediate are shown as green and bright are show as blue. The more distant galaxies tend to be fainter, and also show less clustering, and so the maps has a generally uniform reddish
Galaxy Survey, 2MASS background. The more nearby galaxies tend to be bright, and are more clustered, so the more prominent clusters of galaxies in the map tend to show up as blue. The small empty patches in the map are regions that have been excluded around bright stars, nearby dwarf galaxies, and globular clusters. Figure 03-04 shows an all sky distribution produced by the Two Micron All Sky Survey4 (2MASS) with more than one million galaxies and similar color codes (as the APM). The Milky Way is at the center of the map.

Figure 03-04 Galaxy Survey, 2MASS [view large image]

2dF Galaxy Survey The 2dF Galaxy Redshift Survey5 (completed in 2002) provides yet another view of the large-scale structure as shown in Figure 03-05. It used the 3.9 meter Anglo-Australian Telescope to obtain spectra for nearly a quarter million galaxies up to redshift of 0.20. The pattern is remarkably similar to the computer simulation assuming the WMAP dark matter and dark energy composition of 30% and 70% respectively.

Figure 03-05 2dF Galaxy Survey
[view large image]

[Top]


The Virgo Supercluster6

Virgo Supercluster The Milky Way is a member of the Local Group of galaxies, which in turn is a part of the Virgo supercluster (see Figure 03-06). It is centered on the Virgo cluster and extends some 150 million ly across. The Virgo cluster itself contains thousands of galaxies including M87, which is known to surround a gigantic black hole. Virgo's gravity affects the movement of its neighbors, including the Local Group. The supercluster is the last outpost before a space traveler would enter a nearly galaxy-free region called a cosmic void. Actaully, even the supercluster has a mass equaling some thousand trillion suns, virtually all its volume is empty in such a vast space. The Local Group of galaxies extends some 4 million ly across. Most galaxies in the group are considered dwarfs, but the two largest - the Milky Way and the Andromeda galaxy - are giant spirals. The galaxies of the Local Group are traveling together through space - indicating a common origin.

Figure 03-06 Virgo Supercluster[view large image]

[Top]


Formation of Superclusters7

Recently in 1999, the X-ray telescope on the spacecraft Rosat has detected intergalactic wind blowing through superculsters. The observations showed the direction of the winds by the way they bent jets of electrified gases (plasma) emitted from the cores of galaxies (the same effect as bending smoke from a chimney). The wind directions were lined up with the galactic clusters within superclusters, i.e., along the supercluster axis. It seems to feed matter, including stars, galaxies and gas swept up and transported by the winds, into the growing galactic clusters.
computer simulation Formation of superclusters may be the next stage in a process that is shaping and forming fundamental units in the universe. It is believed that the process began after the Big Bang, when matter in the universe expanded out rapidly. Some matter clumped together to form stars. Then gravity took over and the stars formed galaxies, then groups, then clusters and, now, superclusters. The supercluster formation occurring now is at an early stage. These objects may be at the critical point of overcoming the random motion and are now collapsing under its own gravitation into an increasingly dense superstructure. Figure 03-07 is a computer simulation of the growth of large scale structure as matter is accreted along the filaments. Each square represents a step in the evolution of the universe. The sequence commences at redshift 10.0, less than 500 million years after the Big Bang, and terminates at redshift 0 corresponding to the current epoch.

Figure 03-07 Com

puter Simulation of Large Scale Structure Evolution [view large image]

[Top]


Density Fluctuations8

quantum fluctuation 
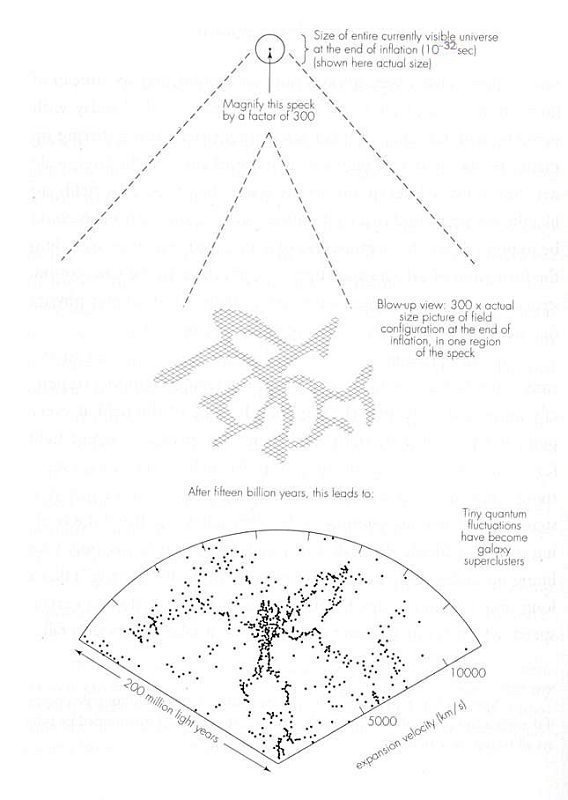
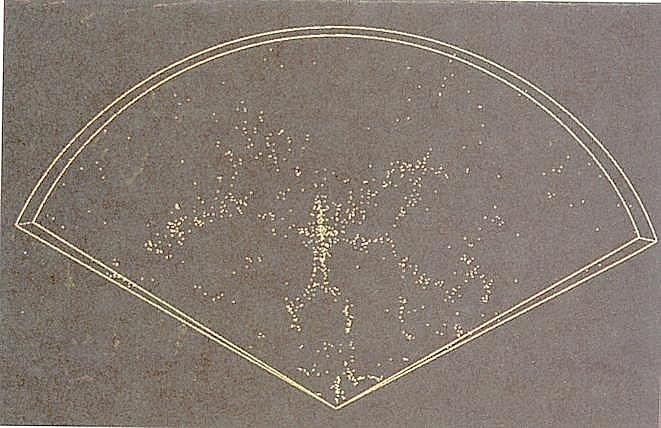
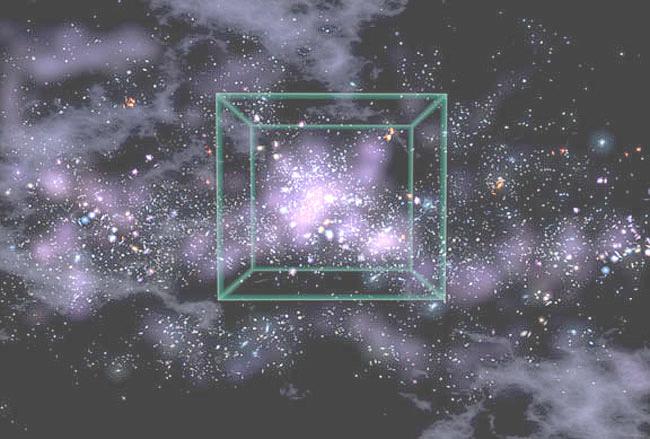
Most theories attribute the origin of large scale structures to quantum fluctuation, which occurred near the beginning of Big Bang. The fluctuation is subsequently enlarged by the inflation and served as a blue-print for the large scale structures such as the superclusters. Figure 03-08 depicts the supercluster formation from quantum fluctuations. The dot at the top shows the actual size, just at the end of inflation. An enlargement (about 300X) of a small section of the universe at this time is shown in the middle. Eventually, after about 14 billion years, the imprint has accumulated enough matter and form the Coma supercluster today. In gravitational terms, the superclusters are merely slight irregularities on a basically smooth universe. It requires only one part in 100,000 of its rest-mass energy to pull the structure apart.

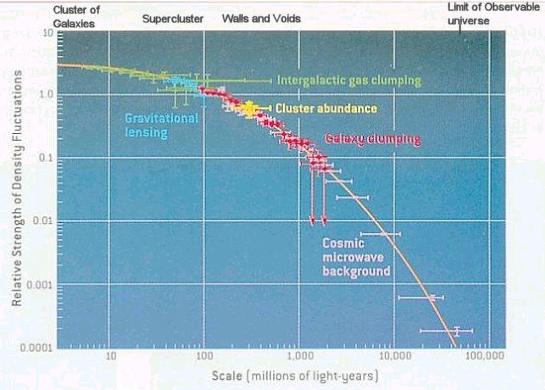
There is a problem with the formation of superclusters. Theory associates a characteristic time for the gravitational settling near the center of a clump. For a density fluctuation of 1.7%, it is of the order of 1 billion years; it would be 13 billion years for 0.3% fluctuation, etc. However, CMBR measurements imply a fluctuation of only 0.001%, which requires a settling time 1000 times longer than the age of the universe. The inconsistency can be resolved only if there is "dark matter" to enhance the fluctuation.

Figure 03-08 Supercluster Formation [view large image]

Since dark matter interacts with normal matter only through gravity, the pressure that kept the normal gas from collapsing coundn't act on it. Particles of dark matter enjoyed an unimpeded assembly into large structures (in the form of primordial fluctuation) long before the normal gas could begin to get organized. By the time normal matter decoupled from the photons, the dark matter had already grown into a primitive web-like network. As soon as the normal matter lost its support from the photon pressure, the gravity from the pre-existing dark matter structures quickly pulled normal gas into the web. In this way, normal matter was given a gravitational "head start" by dark matter.

Cosmic String Recently in early 2004, several new measurements9 of galaxies and clusters in the early universe indicate that the structures involving galaxies and clusters are larger than expected with the new standard "dark-energy" cosmology. The controversy centers on the inability of a dark-energy dominated universe to create such large structures within such a short time (1/5 of the present age). More researches are required to validate such observations. The next step is to map an area of sky ten times larger, to get a better idea of the large-scale structure. Several such surveys are currently under way. Figure 03-09 is a computer-generated illustration of a universe that shows a string of galaxies of the size measured - 300 million light years.

Figure 03-09 Galactic String
[view large image]

[Top]


Power Spectrum of Cosmic Structure

Cosmic Structure The power spectrum of the cosmic structure is different from the CMBR power spectrum since there is insufficient repulsive force to counteract the gravitational attraction. The plot (see Figure 03-09) does not show the "up and down" variation as in Figure 02-08. It displays a smooth curve for the variation of galaxy counts on different scale. The measurements have been taken by both the 2dF and SDSS10 (Sloan Digital Sky Survey) teams with consistent results. Essentially, the measurements were performed with a series of spheres of a given radius at random in the universe and counting the number of galaxies in each one and compute the average difference. The procedure was repeated with spheres of various radii to produce the plot in Figure 03-09, which is in broad agreement with CDM theory.

Figure 03-09 Power Spectrum
[view large image]

[Top]


    References:

  1. Large Scale Structure -- http://astro.uchicago.edu/home/web/olinto/courses/A18200/heffern.html
  2. Large Scale Structure (maps) -- http://www.anzwers.org/free/universe/universe.html
  3. APM Galaxy Survey, Summary -- http://www-astro.physics.ox.ac.uk/~wjs/apm_survey.html
  4. 2MASS -- http://www.ipac.caltech.edu/2mass/
  5. 2dF -- http://www.aao.gov.au/local/www/2df/
  6. Simulated Flight Through the Virgo Supercluster (15 MB Mpeg movies) -- http://www.ifa.hawaii.edu/~tully/
  7. Evolution of Supercluster, Simulation (Mpeg or QT format) -- http://archive.ncsa.uiuc.edu/Cyberia/Cosmos/TheWorksMovies.html
  8. Large Structure Formation, Models -- http://astron.berkeley.edu/~mwhite/modelcmp.html
  9. New Measurement on Cosmic Evolution -- http://www.gsfc.nasa.gov/topstory/2004/0107filament.html
  10. SDSS -- http://www.sdss.org/

[Top]


Index

Coma superclusters
Centaurus Wall
Density fluctuations
Formation of superclusters
Inflation
Intergalactic wind
Large scale structures
Quantum fluctuations
Supercluster evolution
Supercluster map
Virgo supercluster


[Home Page]