| Home Page | Overview | Site Map | Index | Appendix | Illustration | FAQ | About | Contact |
|
|
|
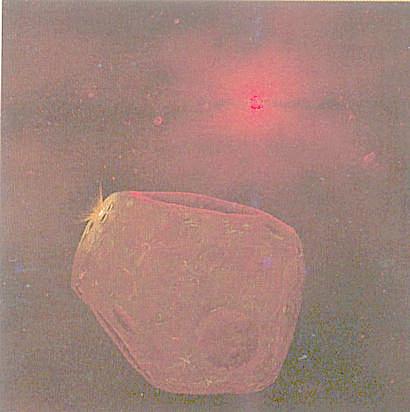
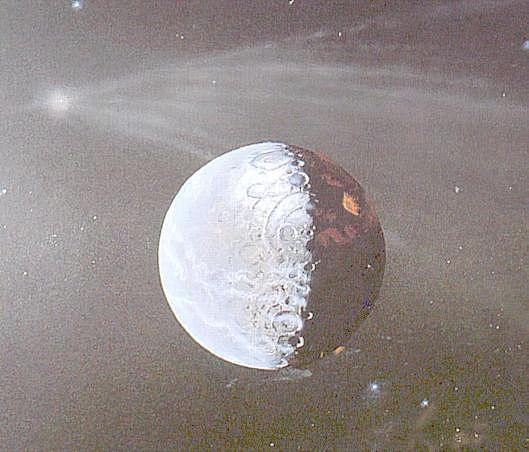
cratered world covered with magma produced by planetesimal impacts. The new world was beginning to acquire a thin atmosphere. The cloud patterns are more belt-like because of the faster rotation. Figure 09-03 shows a primitive |
Figure 09-01 Earth, Embryo, 4560 My ago | Figure 09-02 Earth, Half-sized, 4550 My ago | Figure 09-03 Earth, Primitive, 4540 My ago | Earth in the process of solidification. |
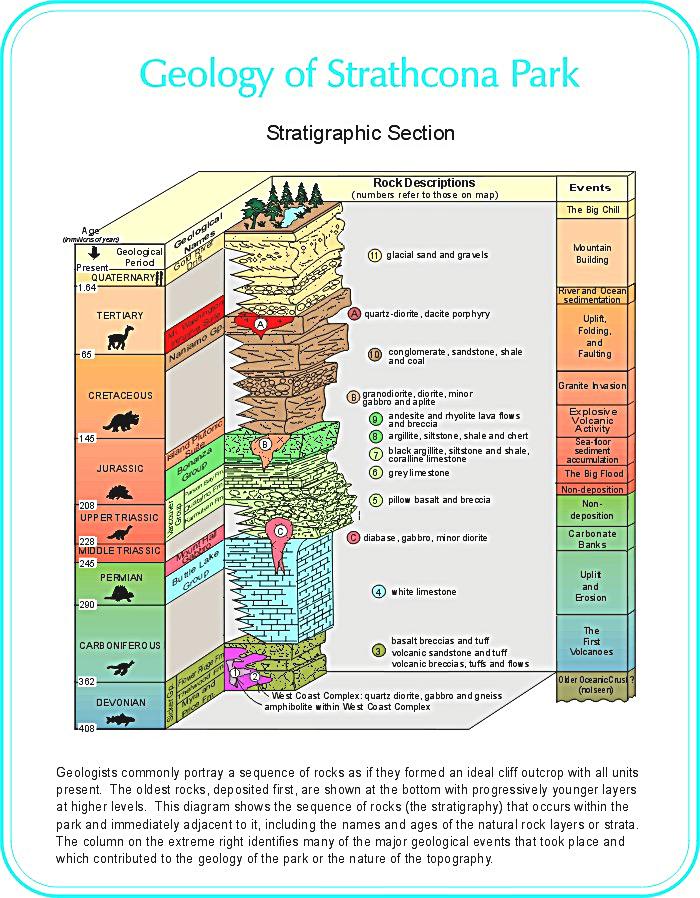 |
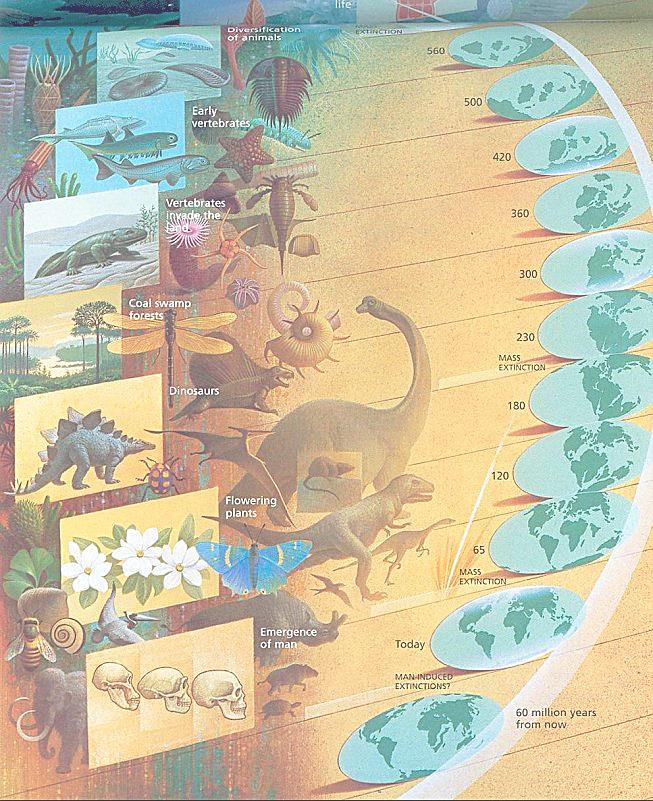
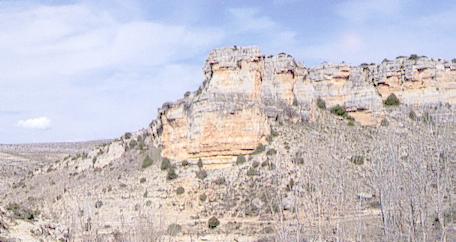
A more reliable history for a small part of the Earth can be found in Strathcona Park, Vancouver Island, Canada; or any places where sedimentary rocks, such as clays, shales, and limestones, are exposed. Figure 09-04 depicts the sequence of rocks (stratigraphy) that occurs within the park and immediately adjacent to it, including the names and ages of the natural rock layers or strata. The bottom layer (earliest) corresponds to the Devonian Period when earliest amphibians and first forests appeared about 400 million years ago. The Strathcona Park website carries all the information about the geology of the Park and more. While the events listed on the right column of Figure 09-04 are related locally to the Park, the Geological Periods on the left column of the Figure is global with events re-constructed by geologists and paleontologists. The periods are shown in Table 09-01 with the geological and biological events. |
Figure 09-04 Earth History | [view large image] |
| PERIOD | MILLIONS OF YEARS AGO |
GEOLOGICAL EVENTS | BIOLOGICAL EVENTS |
|---|---|---|---|
| PRE-CAMBRIAN ERA | |||
| HADEAN | 4560-3800 | Formation of Earth, solidification of crust, condensation of water into oceans. | Prebiotic. |
| ARCHAEAN | 3800-2500 | Beginning of rock record. | Protozoa (unicellular organism). |
| PROTEROZOIC | 2500-540 | Free oxygen in the atmosphere, glaciation¶. | Metazoa (multicellular organism). |
| PALAEOZOIC ERA | (Era of Ancient Life) | ||
| CAMBRIAN | 540-500 (new timescale) | Deposition of Burgess Shale. | Invertebrates (trilobites), corals, sea life of many types proliferating. |
| ORDOVICIAN | 500-425 | Sea covered most of the planet. | Vertebrates, first fish, mass extinction§. |
| SILURIAN | 425-408 | Land plants, jawed fishes, ammonoids. | |
| DEVONIAN | 408-362 | Amphibians, forests, sharks. | |
| CARBONIFEROUS | 362-290 | Swamps and coal bearing rocks. | Insects, ferns. |
| PERMIAN | 290-245 | Formation of Pangaea (the super-continent), desertification occurred. | Reptiles, conifers. |
| MESOZOIC ERA | (Era of Middle Life, Age of Reptiles) | ||
| TRIASSIC | 245-208 | First dinosaurs. | |
| JURASSIC | 208-145 | Oldest surviving ocean floor. | Height of dinosaurs, early mammals and birds. |
| CRETACEOUS | 145-65 | Oil and gas deposits, broke up of Pangaea, global mountain building. | End of the dinosaurs, first flowering plants. |
| CENOZOIC ERA | (Era of Modern Life, Age of Mammals) | ||
| TERTIARY | 65-1.64 | Himalayas and Alps folded. | Evolutionary separation of apes and monkeys, most mammals established. |
| QUATERNARY | 1.64-present | Last ice age. | Modern man. |
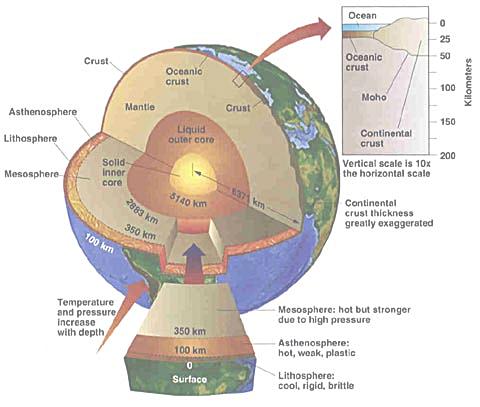 |
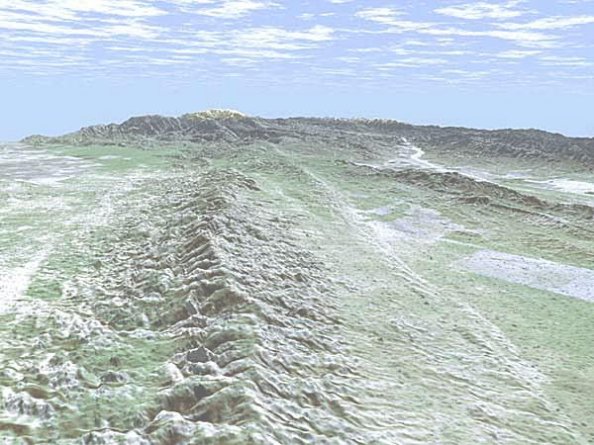
Oceanic crust underlies most of the two-thirds of the Earth's surface, which is covered by the oceans. It has a remarkably uniform composition (mostly 49% ▒ 2% SiO2 ) and thickness (mostly 7 ▒ 1 km). The ocean floor is the most dynamic part of the Earth's surface. As a result, no part of the oceanic crust existing today is more than 200 million years old, which is less than 5% of the age of the Earth itself. New oceanic crust is constantly being generated by sea-floor spreading at mid-ocean ridges, while other parts of the oceanic crust are being recycled into the mantle at subduction zones. |
Figure 09-05 Earth, Structure |
[view large image] |
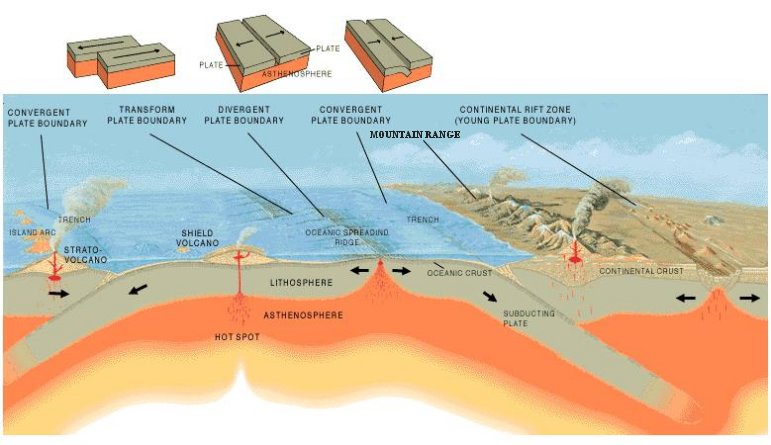 |
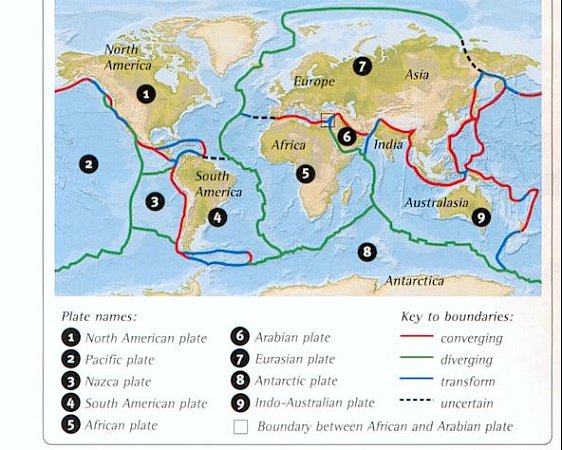
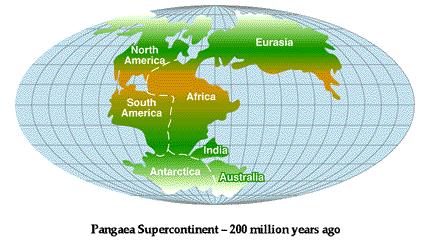
The shapes of the continents suggest that they could be joined like pieces of a jigsaw puzzle. This observation led to the suggestion, made in 1924, that in the distant past there had been one super-continent (pangaea) that broke up, with the various sections drifting apart to form the present-day continents. This concept, called continental drift is supported by the theory of plate tectonics6 - a theory that offers a comprehensive explanation of the distribution of continents, mountain chains, volcanoes, earthquake sites, and ocean trenches. |
Figure 09-06a Plate Tectonics [view large image] |
 |
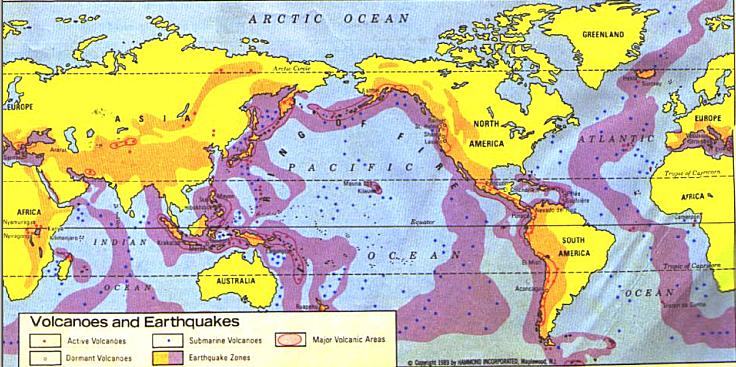 |
For example, the Hawaiian group of volcanic islands, which lie in the middle of the Pacific plate, has been built up while the plate has been drifting over a hot spot. But volcanoes occur most commonly along the boundaries of crustal plates (Figure 09-06c). Crustal movement on continents may result in earthquakes, while movement under |
Figure 09-06b Crustal Plates [view large image] |
Figure 09-06c Earth Quake Zones |
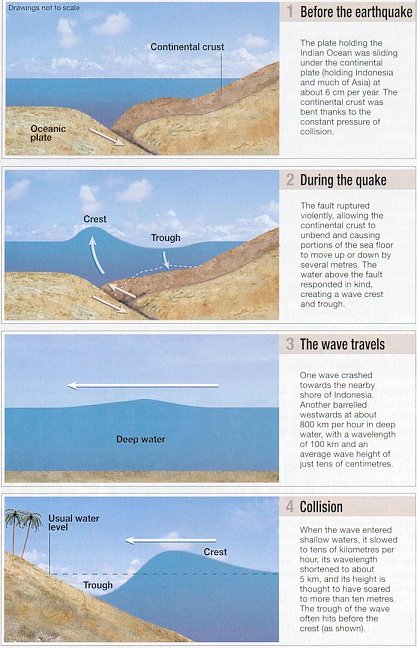
the sea bed can lead to tidal waves (tsunami). |
 |
 |
 |
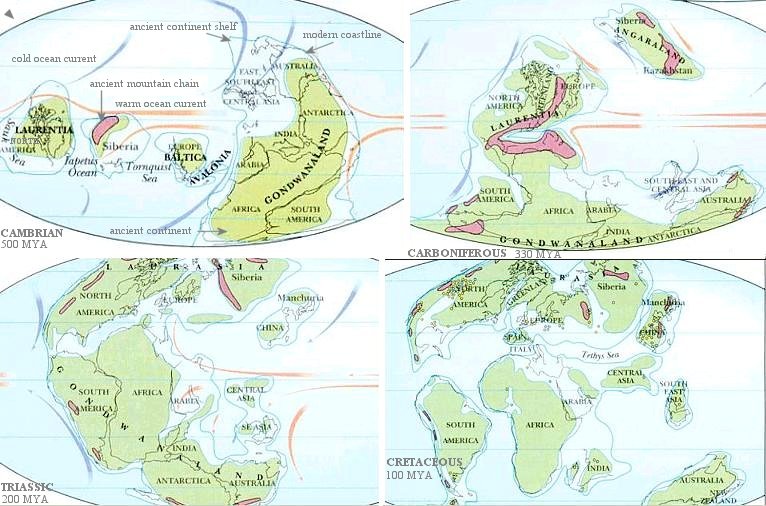
This supercontinent broke up subsequently leading to the present geological distri- bution. The animation in Figure 09-06e shows the change starting from 740 million years ago in steps of 10 million years. To see continental positions during a particular time, click the STOP button of your |
Figure 09-06d Continental Drift [view large image] |
Figure 09-06e Continental Drift [view animation] |
Era |
browser (the  on the toolbar) as the red arrow reaches the era of interest. on the toolbar) as the red arrow reaches the era of interest. |
 |
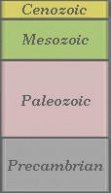
The slow movement of the continents over the surface of the Earth during the past 400 million years has coincided with the entire evolution of land-living animals and plants. As the tectonic plates that created the backdrop to this scene have split apart, collided and slid past one another, they have constantly rearranged the stage on which the drama of terrestrial evolution has been enacted. Continental movements can influence evolutionary pressures by altering the physical environment. A tectonic plate, for example, can move a continent from a tropical to a polar latitude, where the organisms will experience new patterns of competition. The life forms present or absent in a particular part of the world help to define the evolutionary fate of all the other organisms in the community. Land and sea barriers generated by continental drift have, by restricting movements, influenced zoogeographical distribution patterns on the face of the Earth. Organisms that arose and diversified on an ancient landmass, such as Gondwana, have been prevented by large sea barriers from colonizing other landmasses. Figure 09-06f shows the different life form corresponding to different land mass distribution over the last 560 million years. |
Figure 09-06f Life and Continental Drift [view large image] |
 |
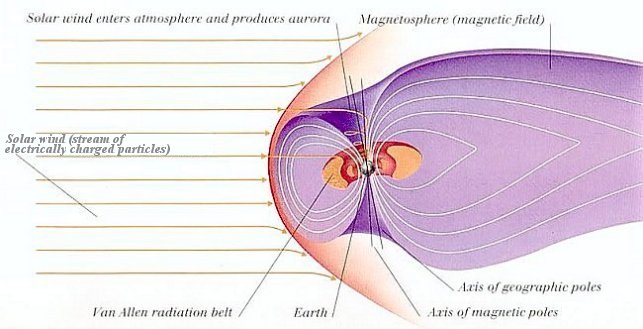 |
The Earth's magnetic field acts as a shield that deflects the solar wind (stream of electrically charged particles) thereby creating an elongated cavity in the wind that is called the magnetosphere as shown in Figure 09-08. The magnetosphere contains large numbers of trapped charged particles, many of which are concentrated in two doughnut-shaped belts called the Van Allen Belts8. Disturbances in the solar wind induce batches of charged particles down the field lines into the upper atmosphere around the polar region. These particles interact with atoms and ions to produce |
Figure 09-07 Atmosphere [view large image] | Figure 09-08 Van Allen Belts |
auroras as shown in the top right of Figure 09-07. |
 |
 |
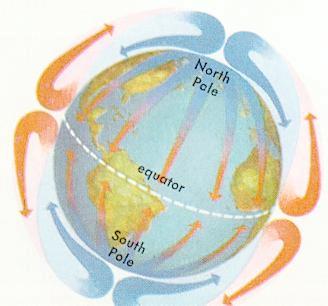
Weather is defined as the atmospheric conditions at a particular time and place; climate is the average weather conditions for a given region over time. Weather conditions include temperature, wind, cloud cover, and precipitation, such as rain or snow. Good weather is generally associated with high-pressure areas, where air is sinking. Cloudy, wet, changeable weather is common in low- |
Figure 09-09 Non-rotating Flow [view large image] |
Figure 09-10 Air Circulation |
pressure zones with rising, unstable air. But long-term weather prediction is unreliable as shown in the Chaos Theory. |
 |
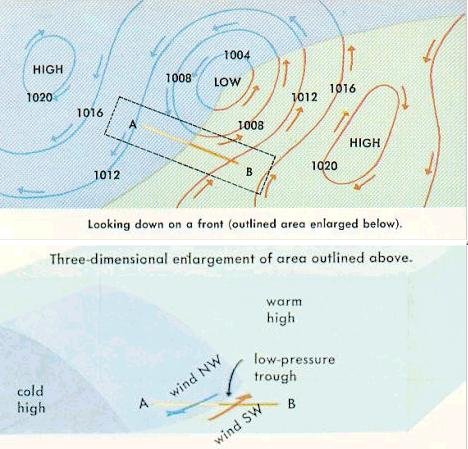 |
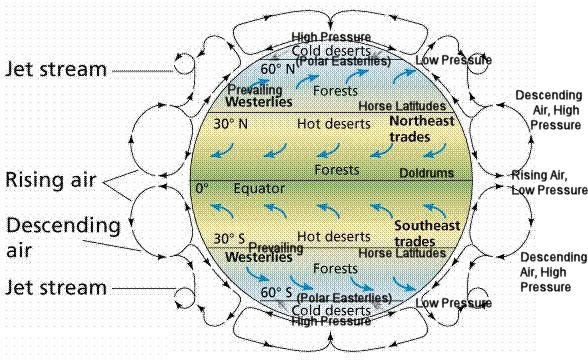
In the northern hemisphere the two well-defined high-pressure regions are the polar high and the horse latitudes (see Figure 09-11). The formation of low-pressure systems is more complicated, however, and involves a wavelike action that occurs between two areas of high pressure with the colder air pushing under the warmer air. As the colder air keeps moving forward, it leaves behind a low-pressure cell of counterclockwise swirling air near the surface (see Figure 09-12). |
Figure 09-11 Air Masses [view large image] |
Figure 09-12 Weather Front [view large image] |
 |
 |
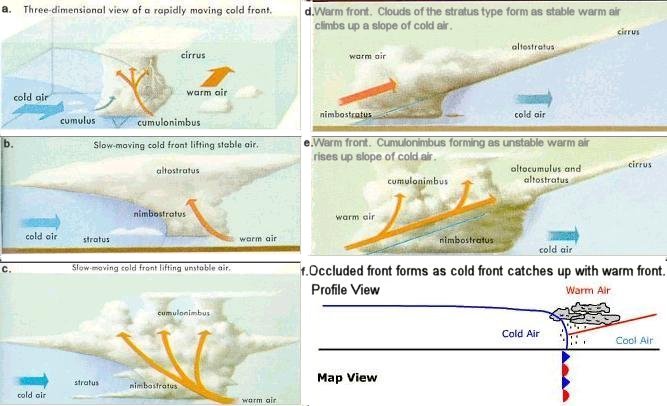
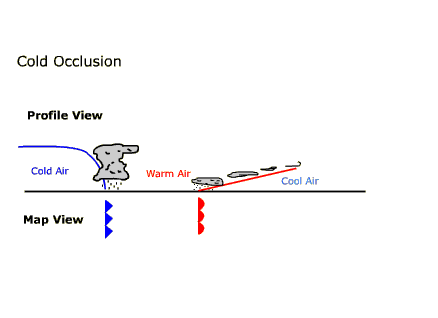
sloping edge of a cold front may extend over several hundred kilometers horizontally, the steepness of the advancing edge means that frontal weather is limited to an extremely narrow band. Storms at a cold front are generally brief though violent. Occluded front is the result of cold front catching up with warm front. The warm air is forced up away from ground level |
Figure 09-13 Types of Front [view large image] |
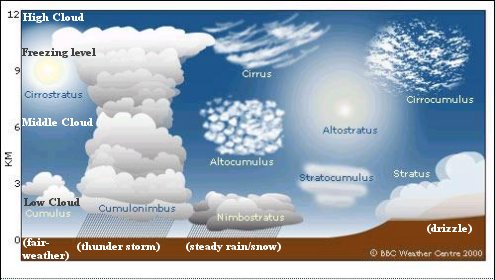
Figure 09-14 Clouds |
(see diagram f in Figure 09-13 or its animated version). |
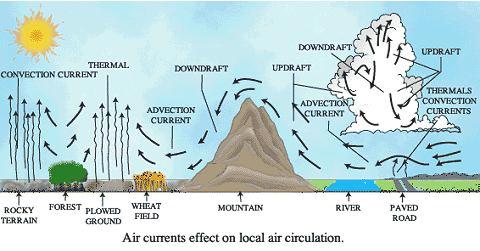 |
Geographical, biological, and man-made factors often make local climatic conditions different from the general pattern. For examples, large lakes moderate temperature extremes; plants create microclimatic differences by their use of water and by their effect on winds; valleys and hills produce difference in temperature, wind speed, and condensations; city is warmer and less windy than countryside. All these local variations alter the movement of air as shown in Figure 09-15. They produce local weather conditions not following the general patterns. |
Figure 09-15 Local Variation of Air Flow [view large image] |
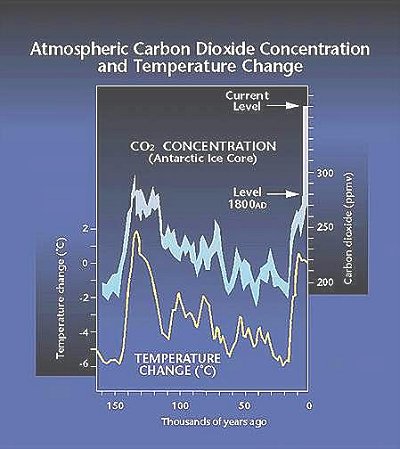 |
dramatic shifts in climate. It is generally assumed the dramatic increase in carbon dioxide concentration in the atmosphere over the past 150 years is largely due to anthropogenic (human-caused) effects. Human beings are causing the release of carbon dioxide and other greenhouse gases to the atmosphere at rates much faster than the earth can recycle them. Fossil fuels - oil, coal, natural gas, and their derivatives - are formed through the compression of organic (once living) material for millions of years, and we are burning billions of tons of these fuels per year. The CO2 expelled into the atmosphere through these activities does not disappear immediately or even over the course of a year. As a matter of fact, the residence times of greenhouse gases (how long they remain in the atmosphere) are on the order of decades to centuries. This means that the impact will be accumulated well into the future of many generations10. |
Figure 09-16 Global Warm- ing [view large image] |
 |
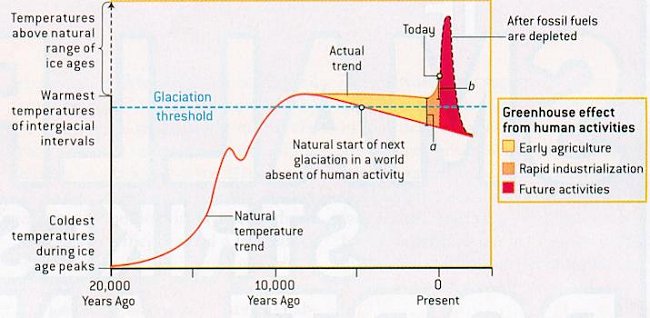 |
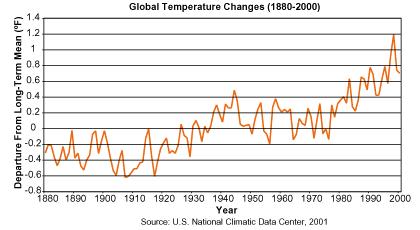
frequency of extreme rainfall events has increased throughout much of the United States. Figure 09-17b shows the greenhouse effect from human activities (agriculture, industrialization) warded off a glaciation that otherewise would have begun about 5000 years ago. |
Figure 09-17a Rising Temp- erature [view large image] |
Figure 09-17b Greenhouse Effect [view large image] |
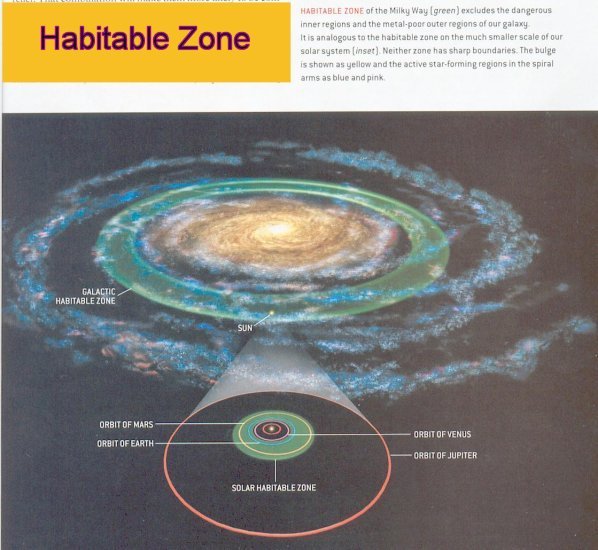 |
It is evident that life arose from cosmic processes just by examining the chemicals in our body. The iron in our blood and the calcium in our bones were made inside stars. All the heavy chemical elements were forged by star that exploded long ago. Terrestrial life is embedded in a cosmic web, and it seems reasonable to speculate that life is cosmically commonplace. There are three ingredients upon which life depends: water, energy, and organic molecules (or carbon). Recent discoveries inform us that these pre-requisites may exist well beyond the planets closely orbiting the sun. This area Ś where conditions might potentially support life Ś is called The Habitable Zone. Figure 09-18 shows such zone in the Milky Way and in particular a zone in the Solar System between Mars and Earth. The galactic habitable zone is envisioned as a ring around the center of our Milky Way galaxy. It may only contain about 20 percent of the galaxy's stars -- including our own sun. Near the core of the Milky Way, life may be unlikely -- comet impacts |
Figure 09-18 Habitable Zone [view large image] |
may be more frequent, and radiation levels are high. Meanwhile, the outer fringe of the galaxy is a difficult place to build life-supporting planets because there are fewer heavy elements. |
 |
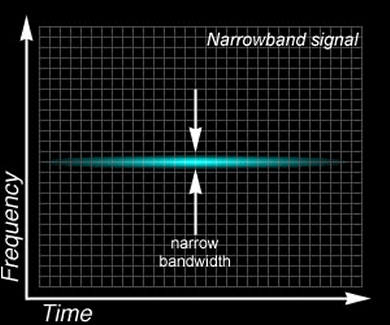
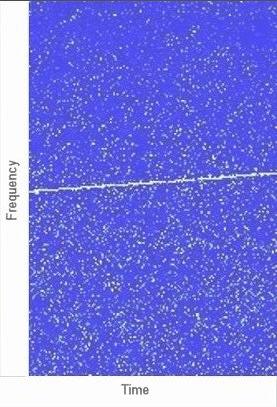
of reports in the media indicate that radio signals (at 1420 megahertz = the hyperfine transition frequency of the hydrogen atom) have been detected three times from a point between the constellations Pisces and Aries. The transmission is very weak and shifting rapidly in frequency. It is pointed out that such drifting of frequency is too rapid to be produced by the rotation of planet and three occasions of detection is not statistically significant. The signals could be generated by a previously unknown astronomical phenomenon, or it could be something much more mundane, maybe an artefact of the telescope itself. |
Figure 09-19 Search for ET |
 |
 |
 |
between a GPS satellite and an unidentified Earth-based source. Many unusual signals from space remain unidentified. No signal has yet been strong enough or run long enough to be unambiguously identified as originating from an extraterrestrial intelligence. |
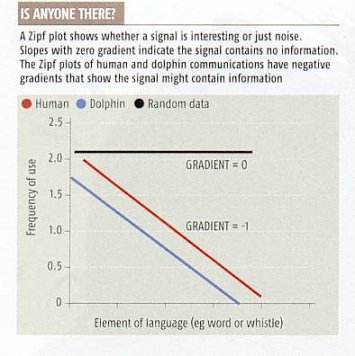
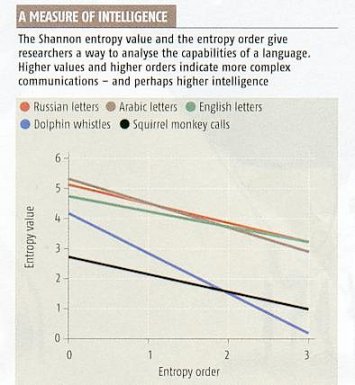
Figure 09-20 ET Signal | Figure 09-21 Zipf Plot | Figure 09-22 Entropy Order [view large image] |
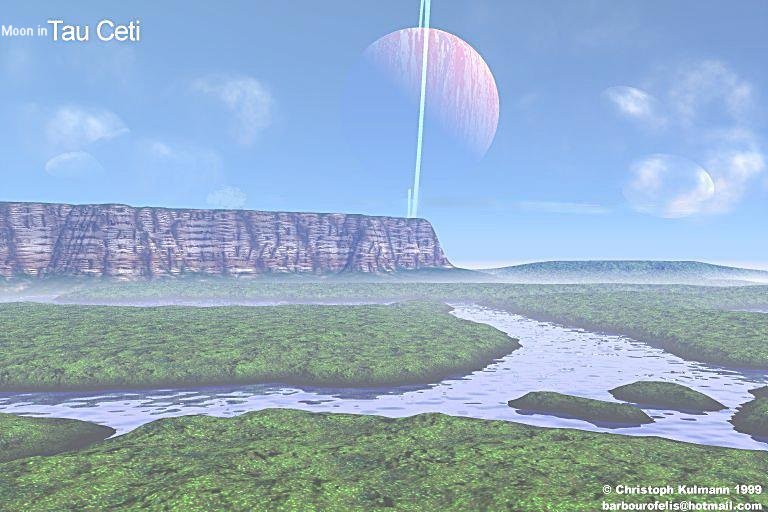 |
In all the great oceans of emptiness, stars of type G are the best candidates to look for life - these are stars like the sun. They are of moderate, but comfortable brightness and remain stable for about 10 billion years - sufficient time for complex life forms to evolve. Tau Ceti is such a G-type, sunlike star, devoid of stellar companions and close enough for detailed studies. It was the first object searched for ET radio signals. Though Tau Ceti has about half the sun's luminosity, its habitable zone still comprises about one third AU - this is wide enough that a terran planet may have formed there. But we know from other stars that giant gas planets are common, and they are often very close |
Figure 09-23 Tau Ceti[view large image] |
 |
|
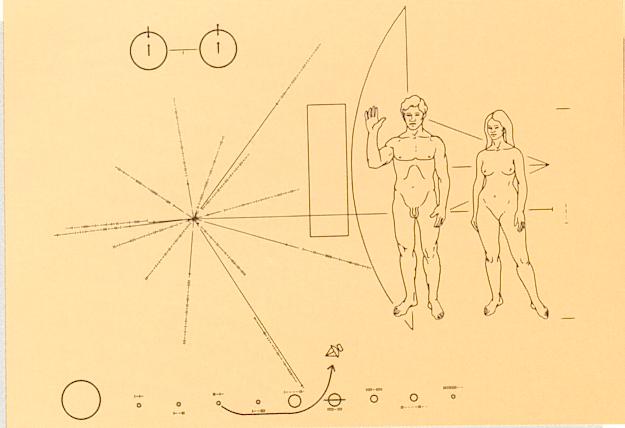
Figure 09-24 Pioneers-10 Plaque [view large image] |
 |
 |
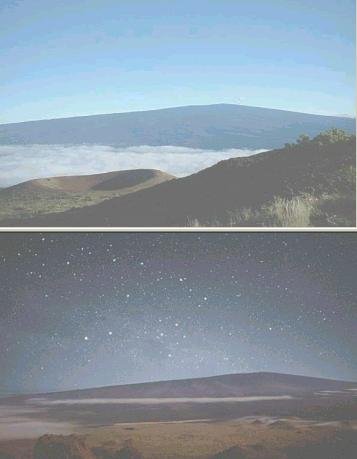 |
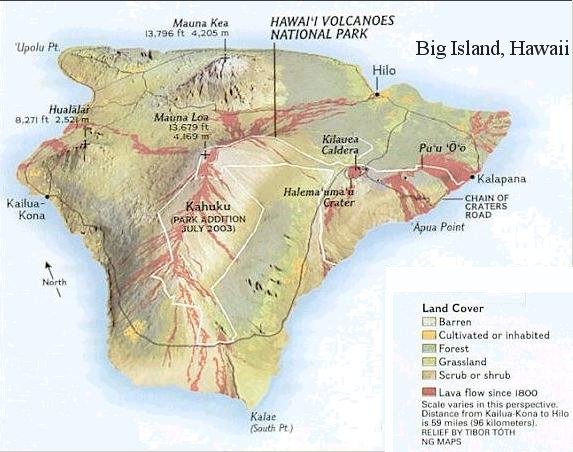
tourist) or study (as scientist) "heaven and hell" at the same time. Mauna Loa (Figure 09-27) in the south is consisted of an active volcanic chain, while Mauna Kea in the north lays dormant. Its summit is the location for the largest collection of modern telescopes taking advantage of the clarity of the Hawaiian night skies. The night view in Figure 09-27 |
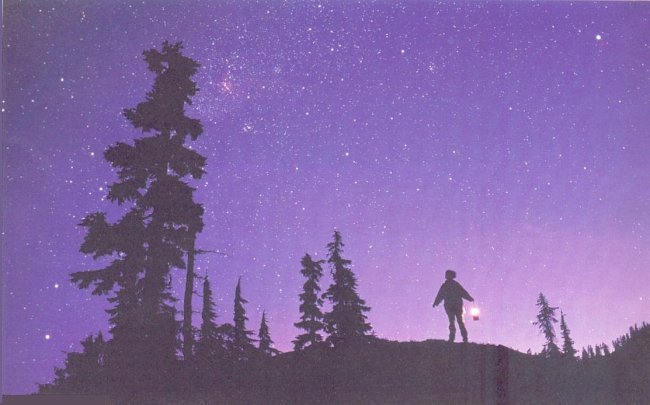
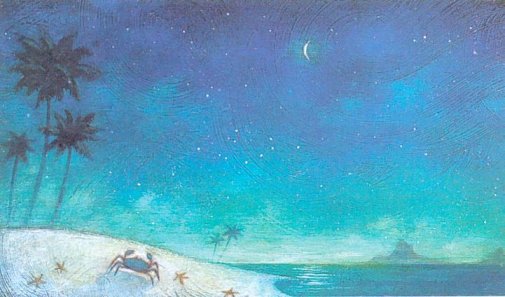
Figure 09-25 Starry Night |
Figure 09-26 |
Figure 09-27 Mauna Loa |
shows the Southern Cross, constellation Crux, near the horizon to the left of Mauna Loa's summit, while the day view reveals a crater in the foreground. |