| Home Page | Overview | Site Map | Index | Appendix | Illustration | FAQ | About | Contact |
|
|
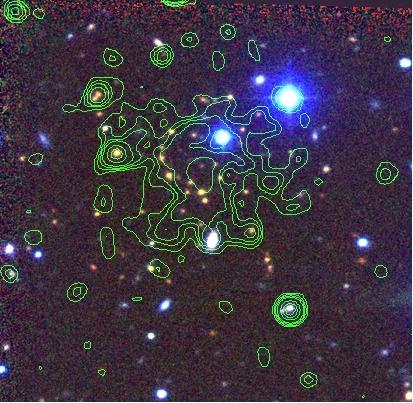
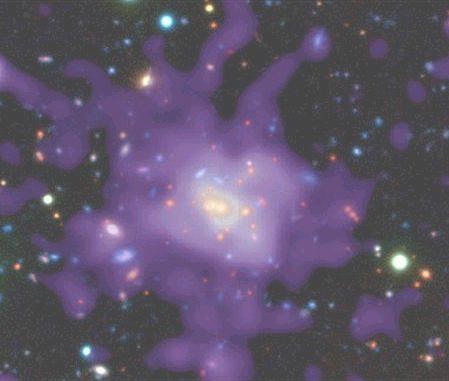
clustering of the galaxies. It can be grouped into two categories - the regular and the irregular. Their properties are shown in Table 04-01 below. Figure 04-01a shows a typical cluster of galaxies at z = 1.10 with contours for X-ray emission. Figure 04-01b shows another cluster about 1 billion light year further away. The X-ary emission shown in purple reveal the hot intracluster gas. It is estimated that the composition of a cluster is 10% galaxies, 20% intracluster medium (gas), and 70% dark matter. |
Figure 04-01a Cluster of Galaxies 1 |
Figure 04-01b Cluster of Galaxies 2 |
| Property | Regular Clusters | Irregular Clusters |
|---|---|---|
| Symmetry | Marked spherical symmetry | Little or no symmetry |
| Concentration | High concentration of members toward cluster center | No marked concentration to a unique cluster center; often two or more nuclei of concentration are present |
| Collisions | Numerous collisions and close encounters | Collisions and close encounters are relatively rare |
| Types of galaxies | All or nearly all galaxies in the first 3 or 4 magnitude intervals are elliptical and/or S0 galaxies | All types of galaxies are usually present except in the poor groups, which may not contain giant ellipticals. Late-type spirals and/or irregular galaxies present |
| Number of galaxies | Order of 103 or more | Order of 10 to 103 |
| Diameter (Mpc) | Order of 1 - 10 | Order of 1 - 10 |
| Subclustering | Probably absent or unimportant | Often present. Double and multiple systems of galaxies common |
| Radial velocities dispersion | Order of 103 km/sec | Order of 102 - 103 km/sec |
| Mass (from Virial Theorem) | Order of 1015 Msun | Order of 1012 - 1014 Msun |
| Other characteristics | Cluster often centered about one or two giant elliptical galaxies | |
| Examples | Coma cluster (A1656); Corona Borealis cluster (A2065) | Virgo cluster, Hercules cluster (A2151) |
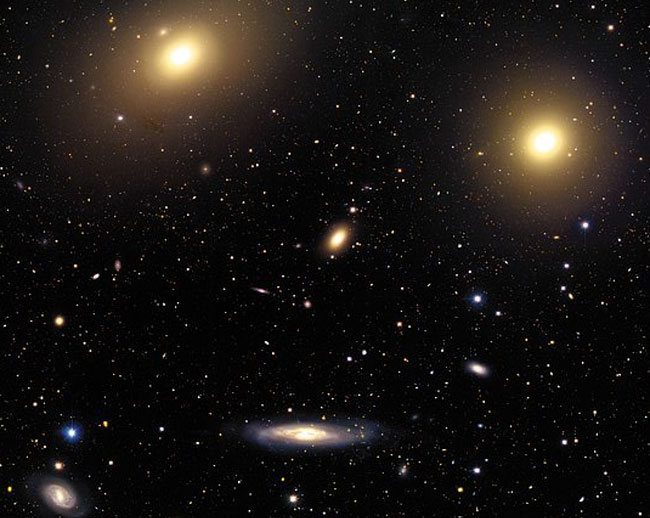 |
Figure 04-02 shows the Virgo cluster as an example of the irregular cluster. It is the closest cluster of galaxies to the Milky Way. There are about 150 large galaxies of many types in this cluster and at least a thousand known dwarf galaxies. At the core of the Virgo cluster lie the three large elliptical galaxies M84, M86 and M87. These galaxies probably formed from the merger of many smaller galaxies and are much more massive than our own galaxy. The cluster contains not only galaxies filled with stars but also gas so hot it glows in X-rays. Motions of galaxies in and around clusters indicate that they contain more dark matter than any visible matter. |
Figure 04-02 The Virgo Cluster of Galaxies [view large image] |
 |
Figure 04-03 shows the Coma cluster (a member of the Coma supercluster) as an example of the regular cluster. It displays the central region with a dominant elliptical galaxy at the center. The X-ray7 emission from the hot and tenuous gas is illustrated in the picture on the right. The gas is thought to be produced by matter ejected from stars in the galaxies over a period of about a billion years and reaches a temperature of 107 oC. |
Figure 04-03 The Coma Cluster of Galaxies |
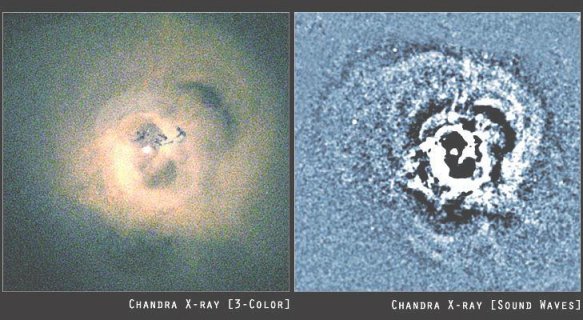 |
The Perseus Cluster - like other large galaxy clusters - is filled with hot, x-ray emitting gas. The x-ray hot gas (not the individual galaxies) appears in the left panel of Figure 04-04, a false color image from the Chandra Observatory. The bright central source flanked by two dark cavities is the cluster's supermassive black hole. At right, the panel shows the x-ray image data specially processed to enhance contrasts and reveals a strikingly regular pattern of pressure waves rippling through the hot gas. In other words, sound waves, likely generated by bursts of activity from the black hole, are ringing through the Perseus Galaxy Cluster. |
Figure 04-04 Hot Gas in Perseus Cluster [view large image] |
Several classification schemes have been developed and correlate reasonably well with one another. One of these is the Rood and Sastry (RS) classification, which is based on the projected distribution of the brightest 10 members. They recognize these types:
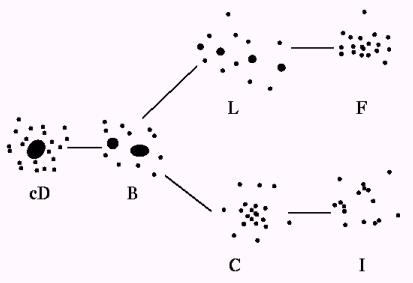 |
These appear to have affinities in a tuning-fork pattern with concentration generally increasing leftward as shown in Figure 04-05a. It conveys a strong impression that the different types are the same kind of system at different stages of development. The evolution sequence seems to be running from right to left. It is highly improbable that clusters of galaxies have been built up by chance encounters of galaxies in the general field. It just takes too long (longer than the age of the universe) to complete the process. Therefore, either that clusters are systems whose member galaxies became gravitationally bound at more or less the same time, or that the clusters represent condensations from pregalaxian material and that subcondensations within them became galaxies. |
Figure 04-05a Cluster of Galaxies Classification |
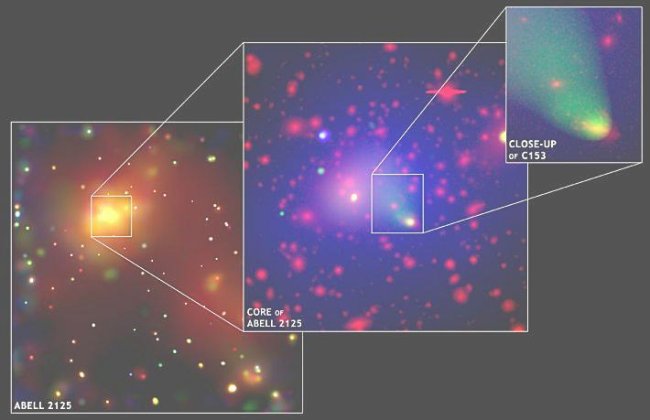 |
nearly 8 million kilometers per hour. Itself a member of the giant cluster of galaxies, C153 may once have been a spiral galaxy like the Milky Way. In this series of images, false-color composites of x-ray and optical data, zooms in on this galaxy's fate. A passage through the hot intracluster gas in the central regions of Abell 2125 is seen to be stripping C153 of its own star forming material and distorting its shape. As other galaxies in the cluster suffer a similar fate, the hot gas collecting in the cluster's core should become enriched in heavy elements. The violent spectacle was taking place about 3 billion lys from Earth and is thought to illustrate a common process in the cosmic evolution of large clusters of galaxies. |
Figure 04-05b Cluster of Galaxies Evolution [view large image] |
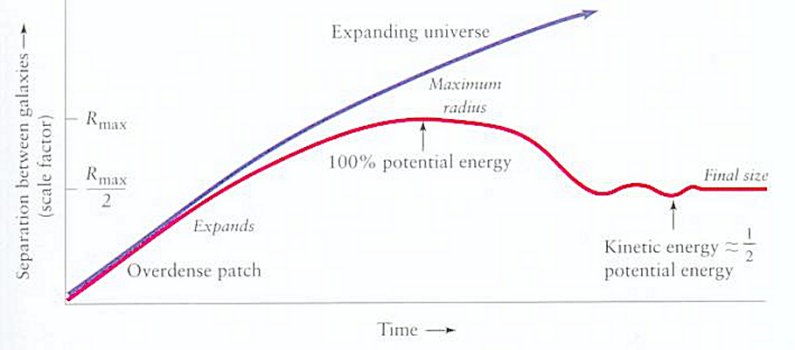 |
One of the cluster formation scenarios suggests that a group of newly formed galaxies (protogalaxy) are expanding away from each other some one billion years or so after the Big Bang. This grouping represented a fluctuation above the average density of its surroundings. Its density would grow and would exert a gravitational pull on itself that is strong enough to counteract the expansion of the universe, and the expansion of the region slowed down. It reached a maximum radius when its density is about five |
Figure 04-06 Cluster of Galaxies Formation [view large image] |
times greater than the background density as shown in Figure 04-06. |
At its radius of maximum expansion, the cloud of galaxies had only gravitational potential energy and no kinetic energy. Then it begins to collapse, it loses potential energy and gains kinetic energy in the form of random motions of the galaxies. Once the kinetic energy equals one-half of the (negative) potential energy, the cloud reached a stage of energy balance and there is a dynamic equilibrium (where the Virial Theorem is applicable). The gravitational field of the cloud no longer changes with time. The kinetic energy of the randomly moving galaxies acts like a pressure that balances the force of gravitational attraction, the result is to produce a stable cluster of galaxies.
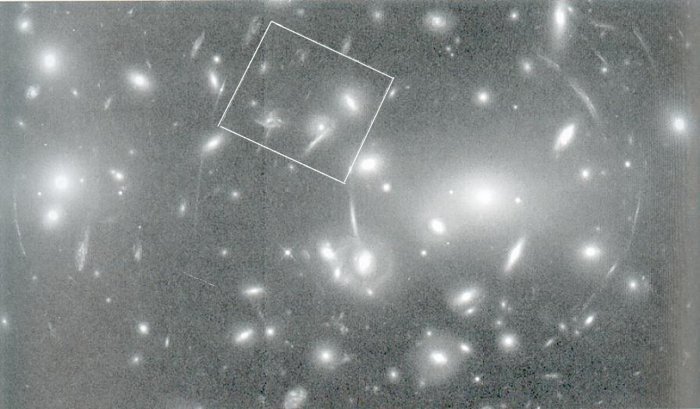 |
When light from a background source, such as a galaxy, passes through the gravitational field of a foreground cluster, it is deflected with the gravitational field acting like a lens. If the alignment is right, an image of the background object will be produced. The image would be larger and brighter than the object would appear without the "lens". If the source, lens, and observer are lined up along a straight line, a distant point of light will be spread out into a ring called an "Einstein ring", whereas if the alignment is imperfect the background source will be seen as two or more arc-shaped images. An example of this phenomenon is shown in Figure 04-07. This is the cluster A2218, which has produced more than 120 arc-shaped images of galaxies that |
Figure 04-07 Gravitational Lens, Abell 2218; |
are members of a remote cluster. Analyses of the lensing effects produced by clusters have confirmed that clusters of galaxies contain from ten to one hundred times as much dark matter as |
 |
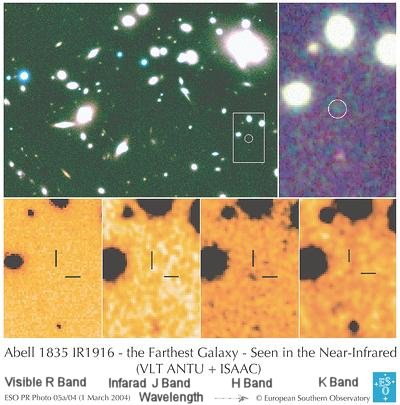 |
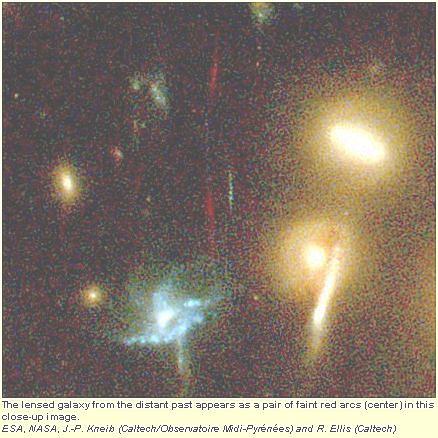
luminous matter. The gravitational lensing of Abell 2218 has revealed a galaxy with redshift of 6.6 - 7.1 corresponding to a look back time of about 13x109 years (750 million years after the Big Bang or 5% the age of the universe). It is among the most distant objects ever observed as shown in Figure 04-08 in the form of a pair of faint red arcs (also see ERO - Extremely Red Object). A March, 2004 report indicates a galaxy still further away at a distance of 13.23x10⁹ ly with a size less than 300 ly across (see Figure 04-09). |
Figure 04-08 Lensing [view large image] |
Figure 04-09 Ancient Galaxy [view large image] |
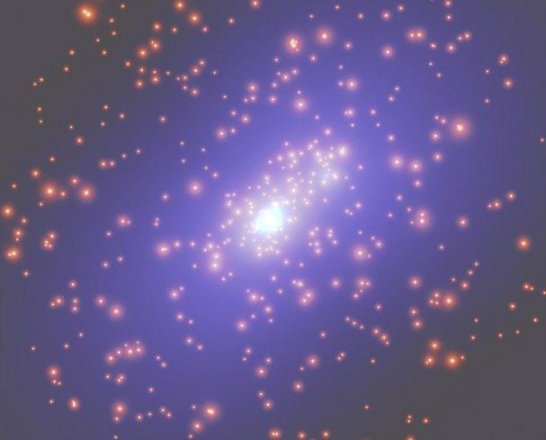 |
By analyzing the distribution of luminous matter and the properties of the gravitational lensing due to total cluster mass in CL0025+1654, researchers have solved the problem of tracing the dark matter layout. Their resulting map shows the otherwise invisible dark matter in blue, and the positions of the cluster galaxies in yellow. The work, based on extensive Hubble Space Telescope observations, reveals that the cluster's dark matter is not evenly distributed, but follows the clumps of luminous matter closely as shown in Figure 04-10. The finding bears not so much on whether the dark matter is self-interacting (in addition to gravitational interaction) but on the "bottom up" theory in which gravity is believed to have assembled increasingly large structures from small ones as the universe aged and expanded. |
Figure 04-10 Dark Matter |